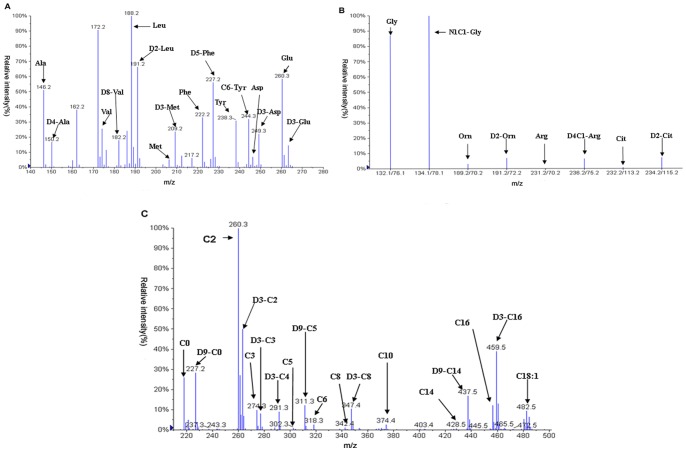
Figure 1. A typical LC-MS/MS spectrum of blood spots from patients.
Blood samples were prepared and mass spectrometric analysis of individual sample was performed as described in “Methods” in details. Panel A shows a mass spectrum was acquired in the neutral loss scan mode. The scan was range from m/z 140 to m/z 280. It can detect most of the amino acids. Panel B shows a mass spectrum was acquired in the multiple reaction monitor mode. It was mainly used to detect Gly, Orn, Arg, Cit and its internal standard. Panel C shows a mass spectrum was acquired in precursor ion scanning mode. It used to detect the acylcarnitine in the sample.

