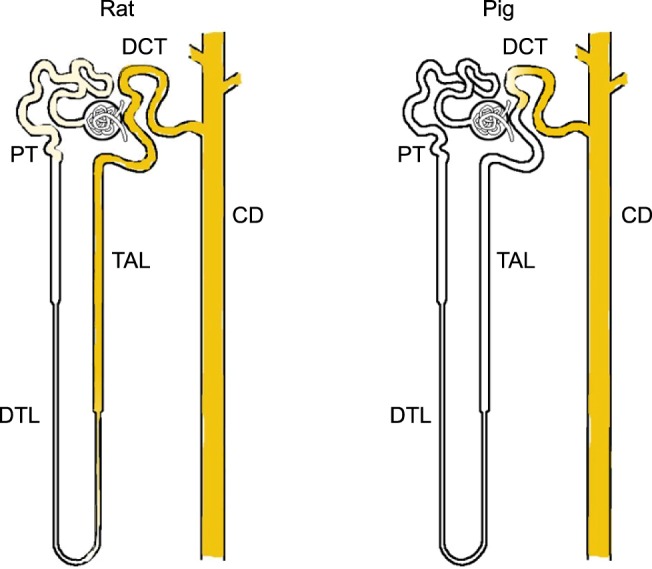
Fig. 6.

Diagram illustrating E-cadherin expression patterns in rat and pig kidney. In contrast to the rat, E-cadherin expression was not detected in the thick ascending limb of the pig kidney. DCT: distal convoluted tubule, PT: proximal tubule, CD: collecting duct, TAL: thick ascending limb, DTL: descending thin limb.
