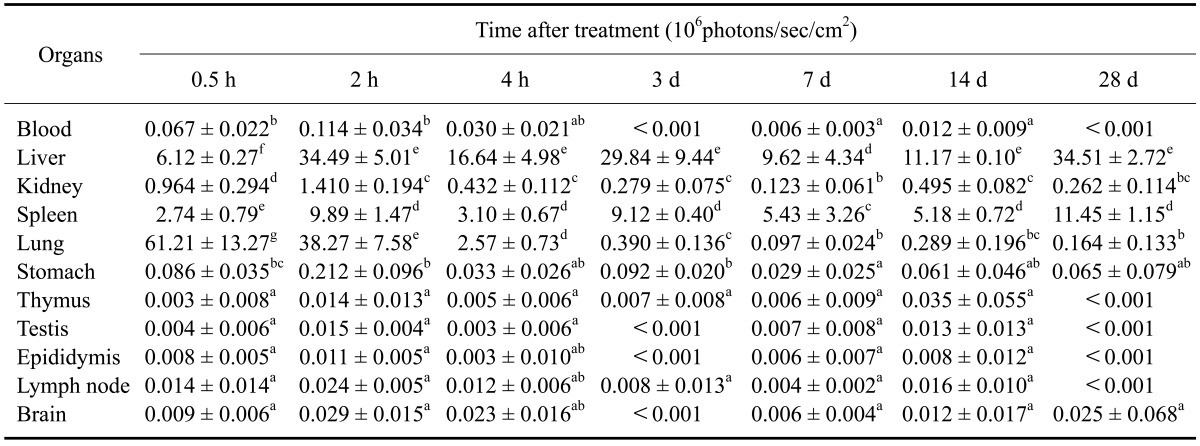
Table 2.
Relative fluorescence intensity measured during a 28-day period in various organs of mice injected with Cy5.5-labeled TCL-SPION

Data are expressed as the mean ± SD. Images were acquired with an exposure time of 1 sec using the Cy5.5 filter channel (615~707 nm). The value means ROI densities of various organs in each mouse. a-gMean values with different letters in the same column are significantly different (p < 0.05).
