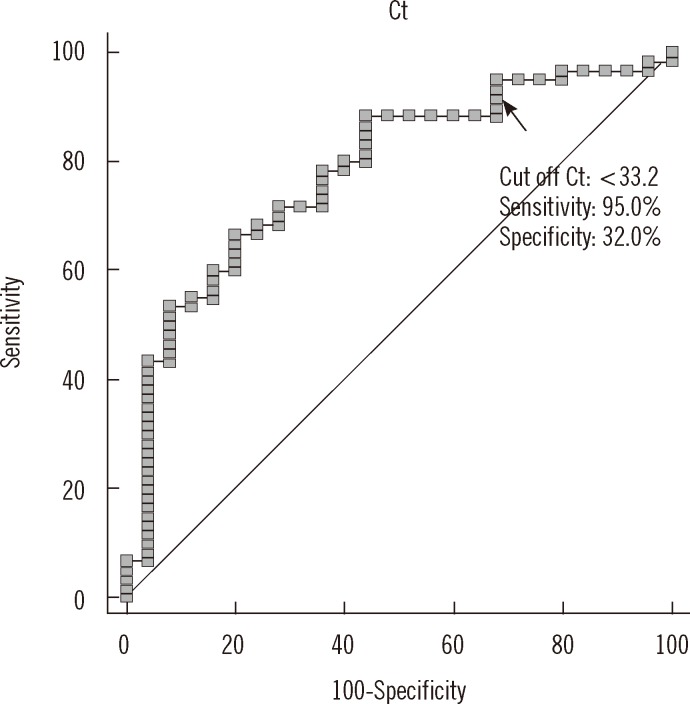
Fig. 5.
ROC curve analysis showing cutoff Ct value for stain positivity. Stain positivity was defined for all concentrated specimens that were graded as "trace or greater." A cutoff Ct value of <33.2 best predicted stain positivity, with a sensitivity of 95.0% (95% CI, 86.1-99.0%), specificity of 32.0% (95% CI, 14.9-53.5%), positive predictive value of 77.0% (95% CI, 65.8-86.0%), and negative predictive value of 72.7% (95% CI, 39.0-94.0%).
Abbreviation: Ct, cycle threshold.

