
Table 4.
Correlation of obesity-related indices with stroke volume and cardiac output
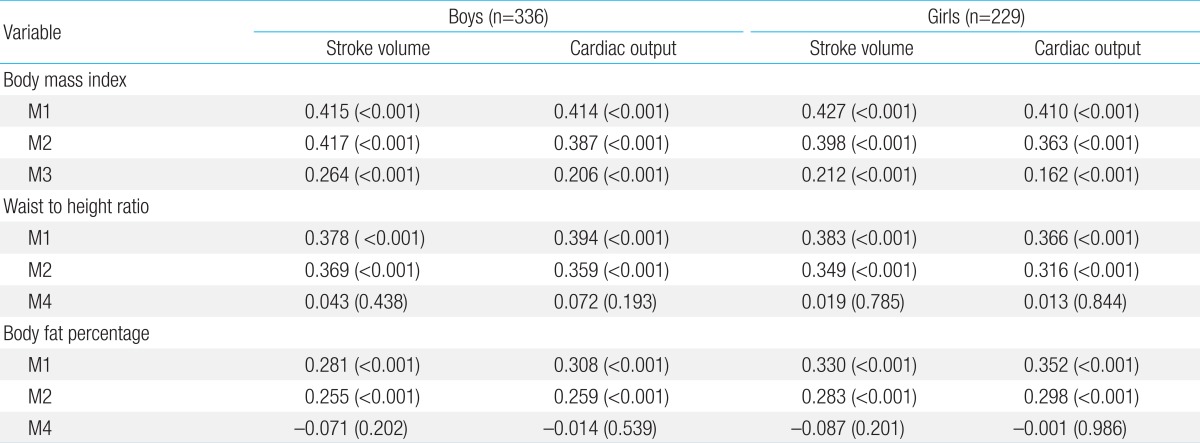
P values are provided in parentheses.
M1, adjustment for age and height; M2, adjustment for lipid panel, glucose, and C-reactive protein in addition to M1; M3, adjustment for waist-to-height ratio and body fat percentage in addition to M2; M4, adjustment for body mass index in addition to M2