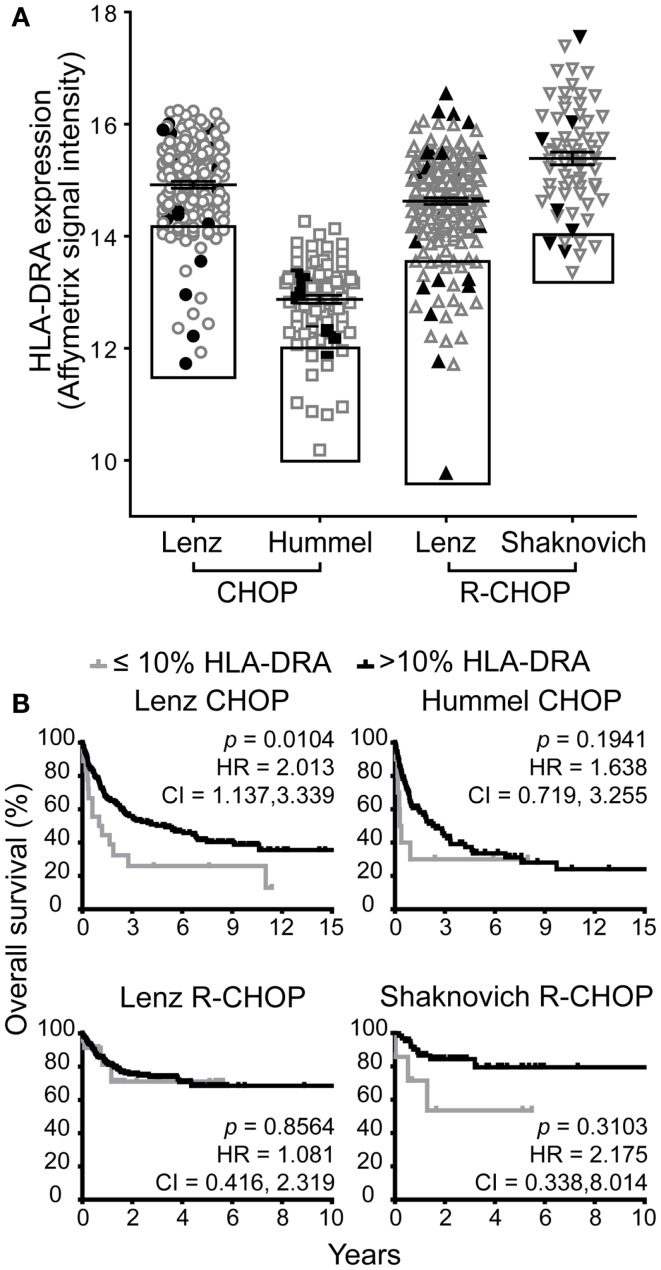
Figure 2.
Low HLA-DRA gene expression is associated with poor survival in one of four DBLCL cohorts. (A) The relative mRNA expression of HLA-DRA in each patient in the four cohorts. Each symbol represents a single patient. The line and error bars indicate the mean ± SEM. The box indicates the 10% of patients with the lowest HLA-DRA expression. The closed, black symbols denote the 10% of patients with the lowest GILT expression shown in the boxes in Figure 1A. (B) Kaplan–Meier survival curves comparing patients with ≤10% expression of HLA-DRA (gray line) to patients with >10% expression (black line). The p-values, hazard ratio (HR), and 95% confidence interval (CI) comparing survival of patients with ≤10 and >10% expression of HLA-DRA are indicated for each cohort. Lenz CHOP: n = 18 ≤ 10% HLA-DRA, n = 163 > 10% HLA-DRA, Hummel CHOP: n = 10 ≤ 10% HLA-DRA, n = 92 > 10% HLA-DRA, Lenz R-CHOP: n = 23 ≤ 10% HLA-DRA, n = 210 > 10% HLA-DRA, Shaknovich R-CHOP: n = 7 ≤ 10% HLA-DRA, n = 62 > 10% HLA-DRA.

