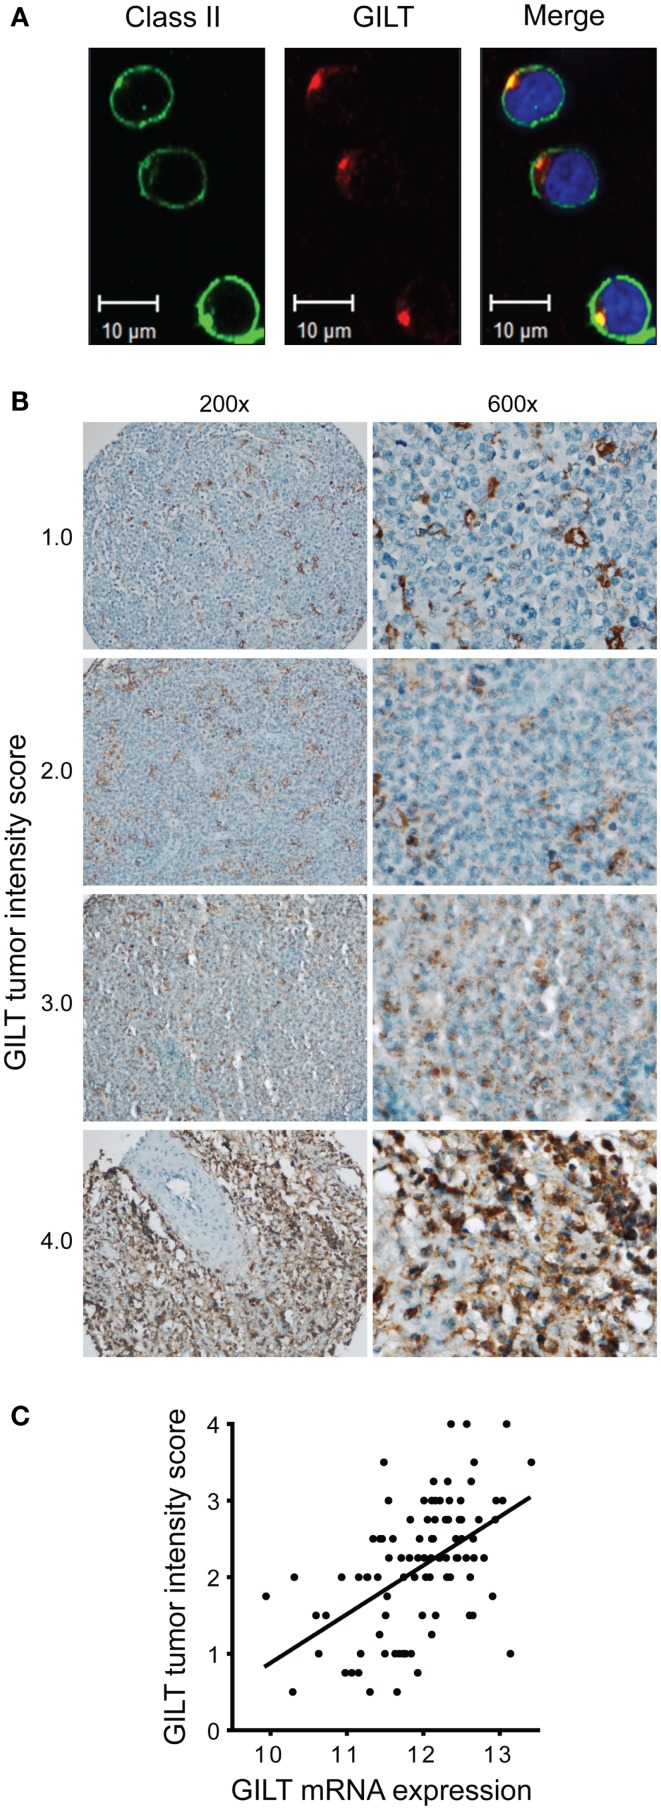
Figure 5.
Variation in GILT protein expression in DLBCL tumor cells correlates with mRNA expression. (A) In OCI-LY19, a DLBCL GCB subtype cell line, GILT and HLA-DR expression were detected with Alexa Fluor 555-conjugated and Alex Flour 488-conjugated secondary antibodies, respectively. Images were viewed using a Zeiss LSM 710 confocal microscope with a Plan-APOCHROMAT 63×/1.4 objective lens and Immersol 518, and acquired with Zen LE software (Carl Zeiss Microimaging Inc., Thornwood, NY, USA). (B) Low (original magnification, ×200) and high power view (original magnification, ×600) of representative GILT staining in DLBCL patient TMA specimens. Each specimen is labeled with GILT tumor intensity score, which reflects the intensity of GILT staining and the number of GILT-expressing vesicles in the malignant B cells (scale from 0 to 4). As a reference, benign tonsillar B cells were scored as 2.0. Images were acquired using a Nikon ECLIPSE 80i microscope with a 20×/0.50 or 60×/0.95 objective lenses, a Nikon DS-Ri1 camera and Nikon NIS-Elements Imaging software v3.13. (C) GILT mRNA expression in the tumors from 96 DLBCL patients in GEP studies correlated with GILT protein expression in the tumor cells (GILT tumor intensity score) (Spearman ρ = 0.53, p < 0.0001).

