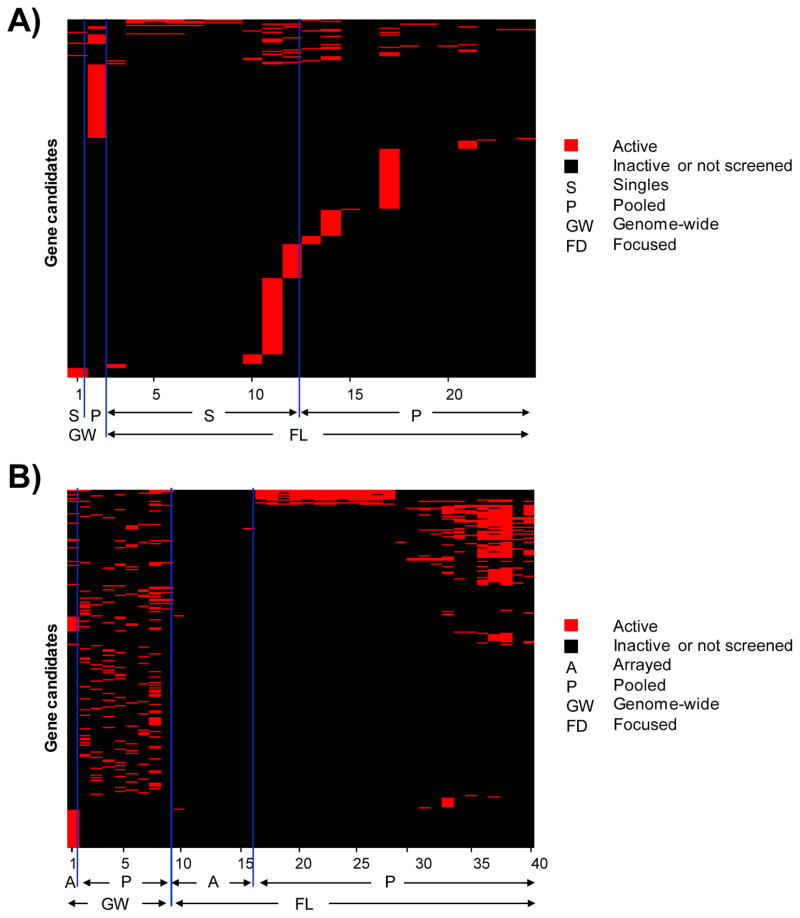
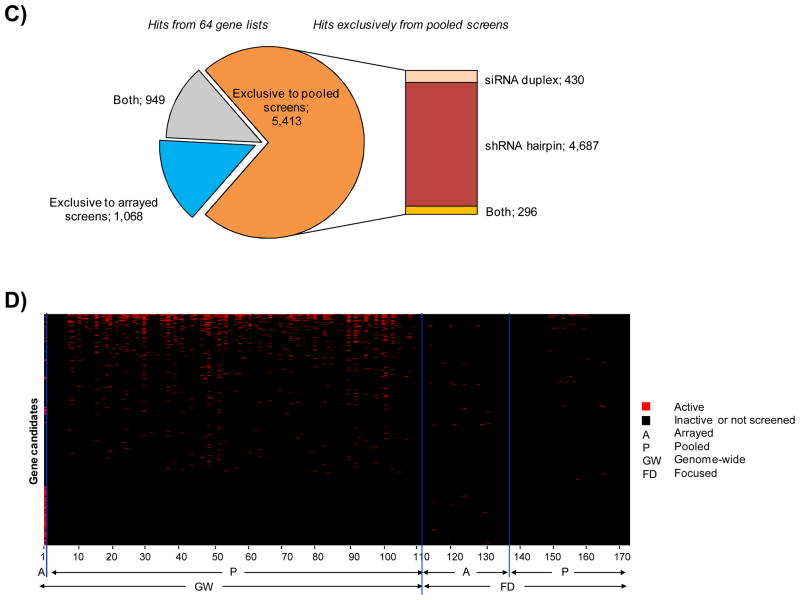
Figure 6. Visualization of hit preponderance in siRNA duplex versus shRNA hairpin screens.
A) Heat map plot representation of global overlap among 1,525 genes in siRNA duplex screens. B) Heat map plot representation of global overlap among 6,664 genes showing prominence of hits from pooled shRNA hairpin screens. C) Pie chart illustrating the breakup of gene candidates obtained from each category at the stage of global overlaps. A strong enrichment of hits originating exclusively form shRNA hairpin pooled formats can be observed. D) Heat map plot representation of stringent overlap among 3,644 genes showing prominence of hits from pooled shRNA hairpin screens.
The gene lists are ordered based on the screening format and are sorted by numbers corresponding to the publication index (Suppl Table 6).


