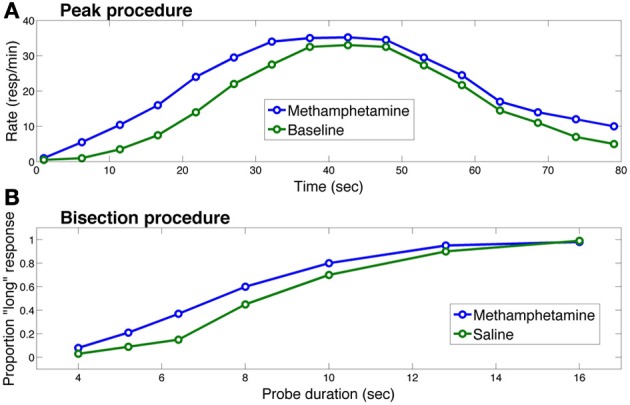
Figure 2.

Effects of methamphetamine on timing in (A) the peak procedure and (B) the bisection procedure in rats. Each curve in (A) represents response rate as a function of time, where time 0 corresponds to the trial onset. The methamphetamine curve corresponds to sessions in which rats were injected with methamphetamine; the baseline curve corresponds to sessions in which rats did not receive an injection. Each curve in (B) represents the proportion of trials on which the rat chose the “long” option as a function of probe cue duration. The saline curve corresponds to sessions in which the rat received a saline injection. In both procedures, methamphetamine leads to overestimation of the elapsing interval, producing early responding in the peak procedure and more “long” responses in the bisection procedure. Figure replotted from Maricq et al. (1981).
