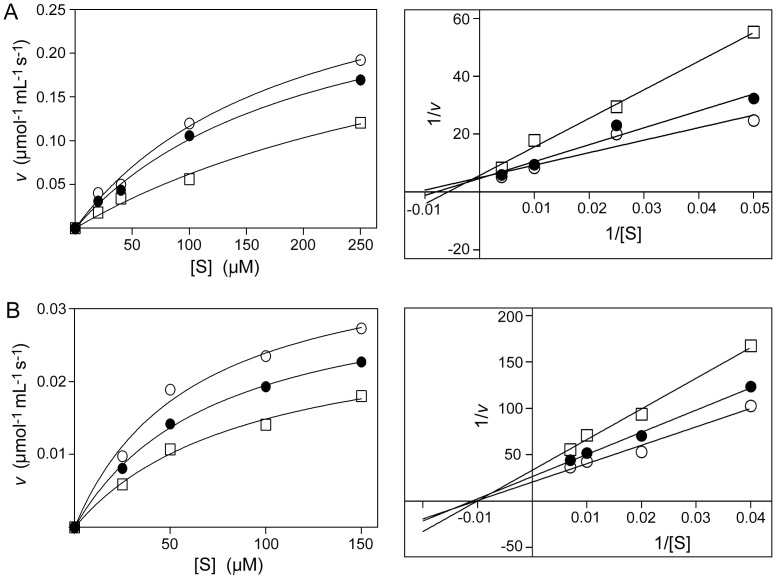
Figure 6. Effect of quinine on in vitro TPH2 activity.
(A) Initial rate of activity of the purified catalytic domain of human TPH2 (v) was assayed in the presence of 0 ( ), 2 (
 ) or 10 (
 ) mM QN at different concentrations of the L-tryptophan substrate [S]. Points are means from three replicate determinations of v. SEMs were smaller than the dimensions of the symbols. The data are presented as substrate saturation curves (left panel) and Lineweaver-Burk plots (right). (B) As in (A) but where [S] refers to different concentrations of the TPH2 co-factor 6MePH4.

