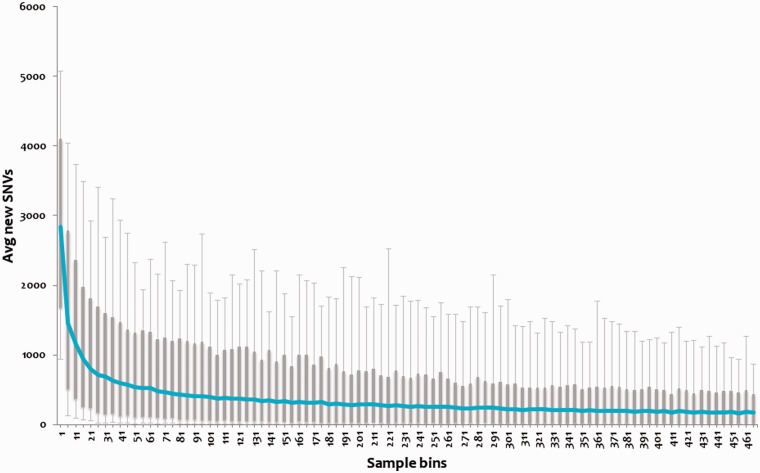
Figure 3.
Variations plotted across subset of the genomes. Each bin of five samples was randomly chosen for 1000 iterations, and novel SNVs were identified. This number for each bin was averaged, and a box plot was plotted. The 95 percentile and 5 percentile form upper and lower boxes, while upper and lower error bars indicate maximum and minimum, respectively. The blue line passing through the boxes indicates average per bin of samples.

