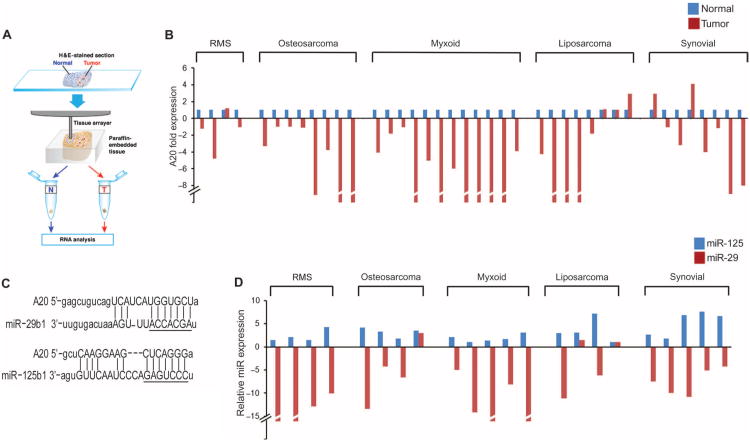
Fig. 2. Abundance of A20 and miR-29 is decreased in human sarcomas and is inversely correlated with that of miR-125.
(A) Schematic of the extraction of tumor and adjacent normal tissue from paraffin-embedded blocks. (B) qRT-PCR for A20 (normalized to GAPDH) in adjacent normal and tumor tissue sections of sarcoma biopsies. Data are representative of three technical repeats per sample; P = 6.055 × 10⁻⁵, two-tailed parametric t test. (C) TargetScan/MicroRNA prediction analysis for complementary sequences to the 3′UTR of A20. The seed regions of miR-29 and miR-125 sequences are underlined. (D) qRT-PCR for miR-29 and miR-125 in patient tumor material as in (B).

