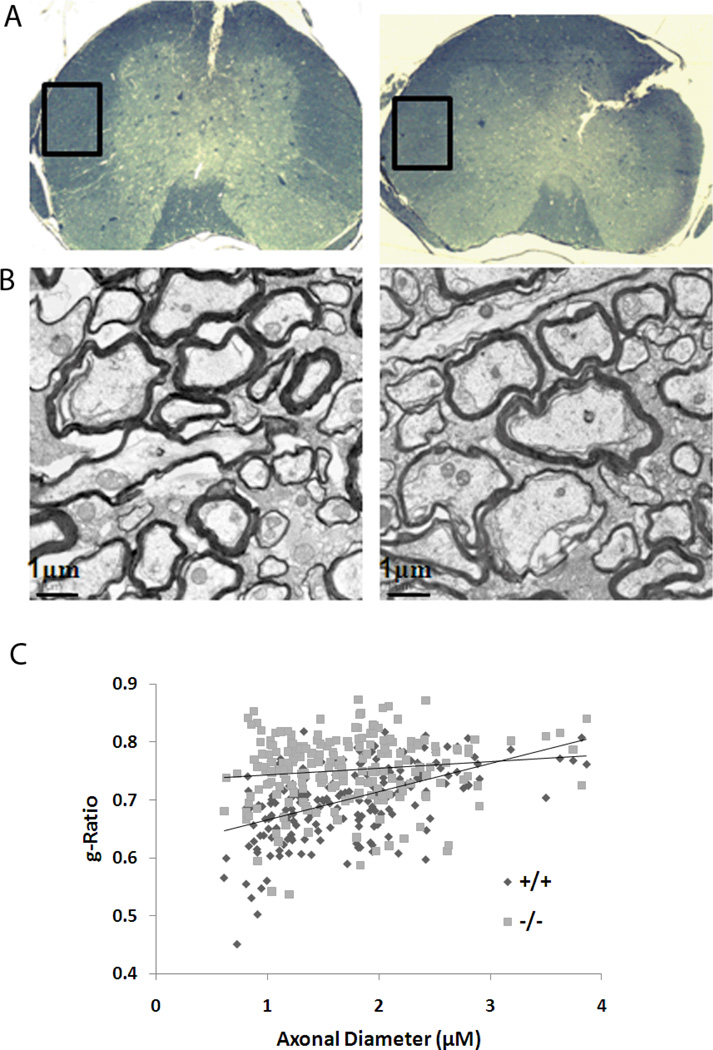
Figure 3.
Ultrastructural analysis of the spinal cord axon fibers. (A) A representative cross-section of the spinal cord showing the location of the white matter that was used from the anterolateral columns and prepared for electron microscopy. (B) Representative electron micrographs from wild-type (left) and Lgi1 null mice (right) showing hypomyelinated axons. [scale bar 1µm]. G-ratio analysis demonstrates a significant hypomyelination in the null mice compared with the wild type mice, particularly in the smaller axons.

