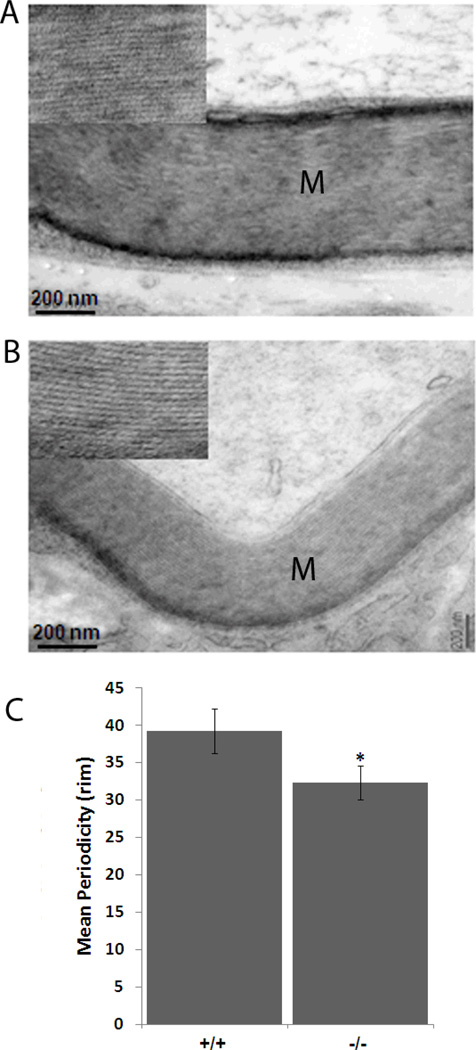
Figure 5.
Analysis of myelin periodicity in normal and Lgi1 null mutant mice. Compared with normal mice (A), reduced myelin compaction is seen in the sciatic nerve of Lgi1-null mice (B), accompanied by differences in myelin sheath thickness (M) [scale bar 200nm]. In (C) the data represent the mean ± S.E.M. from 17 and 27 myelinated fibers respectively for each group. *p < 0.05.

