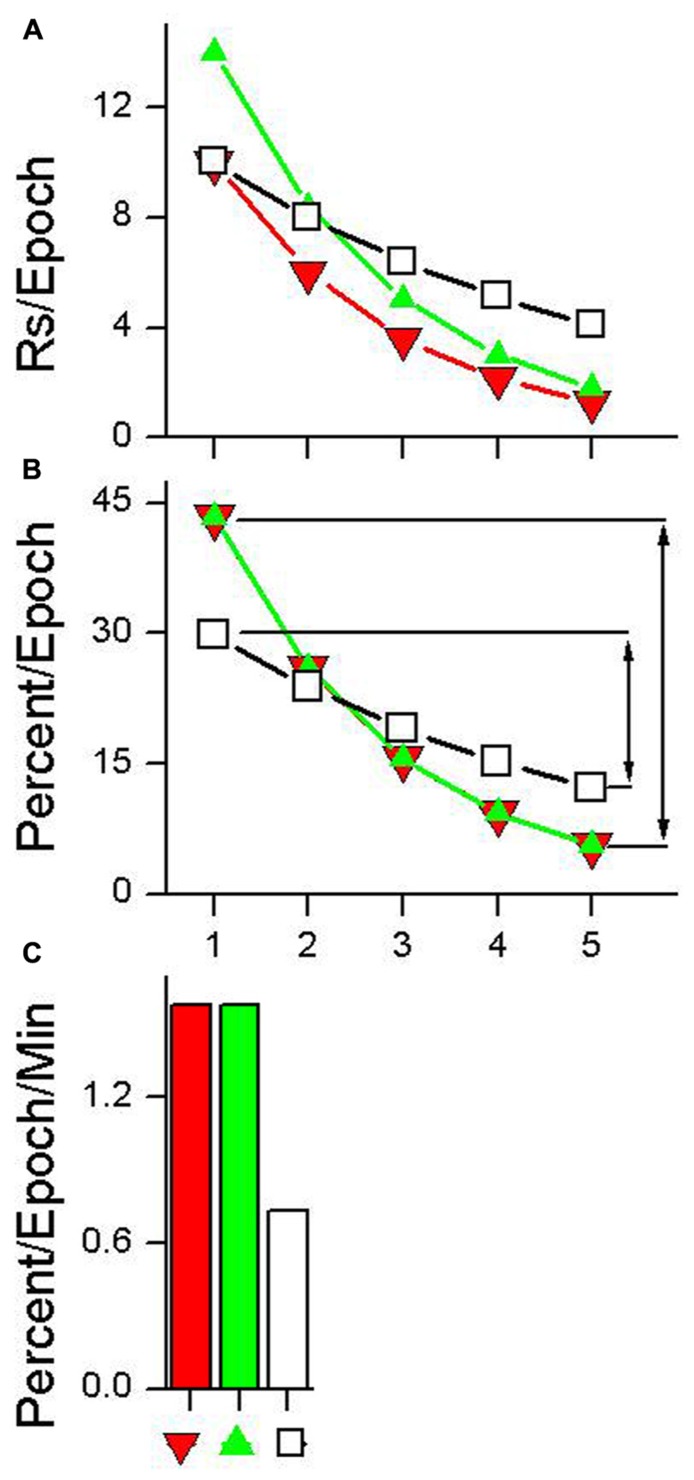
FIGURE 3.
Calculation of habituation rate (HR). (A) Data having different absolute rates of responding plotted as five equal duration epochs. (B) The same data with each epoch plotted as a percentage of total responding. The lines with arrows in plot (B) indicate the difference between the first epoch of the test session and the epoch with the lowest percentage of responding. This difference is divided by the time between the first epoch and the epoch with the lowest percentage of responding to produce the HR measure shown in plot (C). See text for details.

