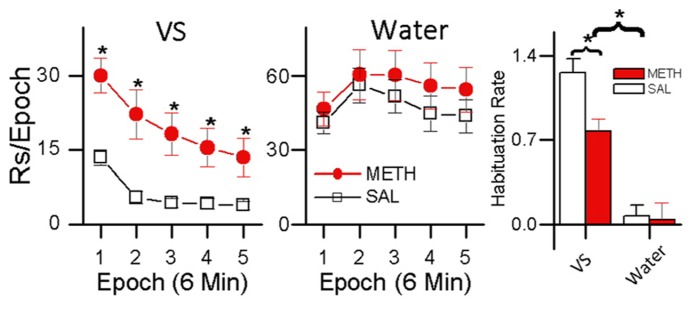
FIGURE 6.
Within-session analysis of the effect of methamphetamine on concurrent schedule performance for water and sensory reinforcers. The left plot shows within-session changes in responding for a sensory reinforcer presented according to a VI 1 min schedule in rats treated with METH (0.5 mg/kg) and saline. Asterisks (*) in the left plot indicate differences in responding (p < 0.05) The middle plot shows within-session responding for a small (0.025 mL) water reinforcer concurrently presented with the visual stimulus shown in the left plot. The histogram plot on the right shows HRE for sensory and water reinforcers and the effects of saline and METH treatment on HRE. In the histogram, asterisks (*) indicate an overall difference in Habituation Rate between VS and water reinforcers (p < 0.05), and a difference in Habituation Rate between the saline and METH treated rats receiving the VS reinforcer (p <0.05).

