
Figure 1.
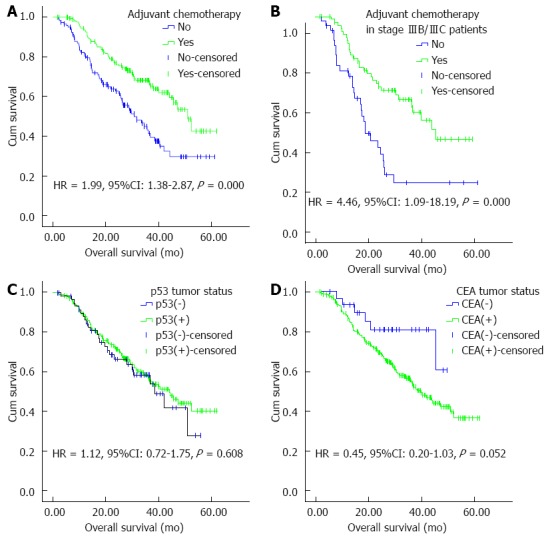
Kaplan-Meier curves for overall survival of patients after D2 gastrectomy for stage II/III gastric adenocarcinoma. A: Adjuvant chemotherapy or not in the entire cohort; B: Adjuvant chemotherapy or not in stage IIIB/IIIC patients; C: p53 tumor status as measured by immunohistochemistry; D: CEA tumor status as measured by immunohistochemistry. HR and 95%CI were calculated with green curves as references. CEA: Carcinoembryonic antigen.