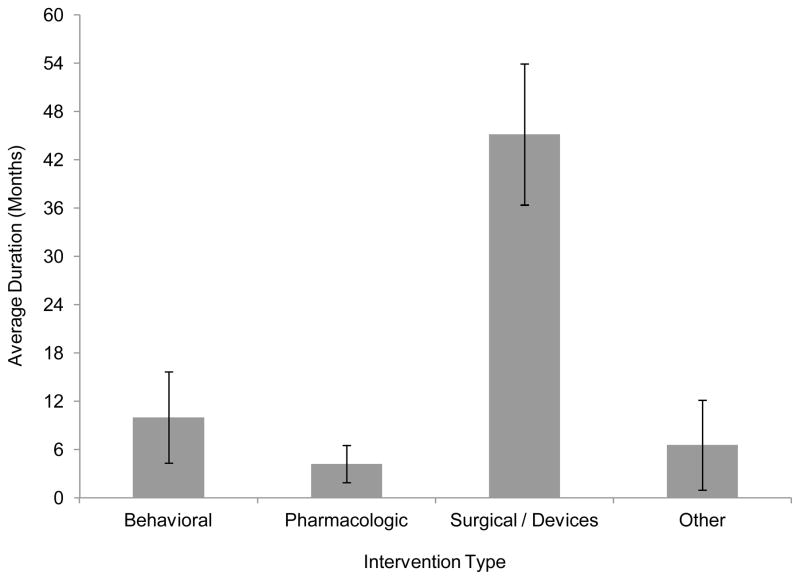
Figure 2. Average Study Duration by Type of Intervention Investigated.
This figure shows average clinical trial study duration, stratified by intervention type (behavioral, pharmacologic, surgical procedures and devices, or other). Average duration is reported in months. The 95% confidence intervals are indicated in the graph.

