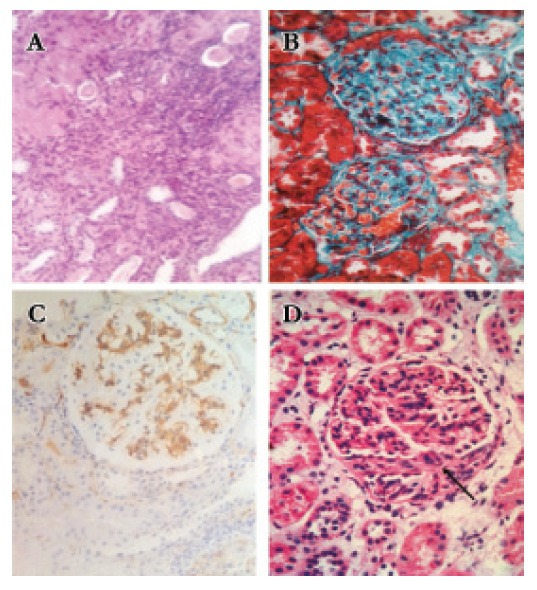
Figure 2.

[A] the section shows prominent tubular atrophy and interstitial fibrosis, H & E x 100. [B] Global sclerosis, tubular atrophy, and interstitial fibrosis, MT x 400. [C] IgA nephropathy showing strong +3 mesangial staining for IgA, x 400. [D] Global hypercellularity with fibrocellular crescent (arrow), H & E x 400.
