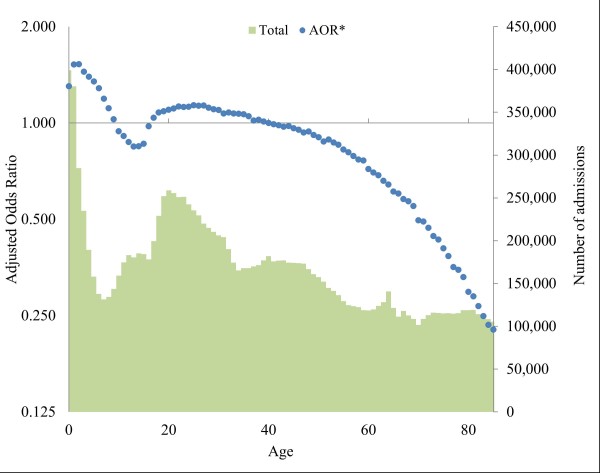
Figure 1.
Adjusted odds ratios (reference age 40) and total attendances by year of age. Ages above 85 not included due to small totals. Confidence intervals were too small to be displayed. Logistic regression model controlled for age, gender and deprivation. Primary Y axis is a logarithmic scale (base 2). *Adjusted odds ratio.

