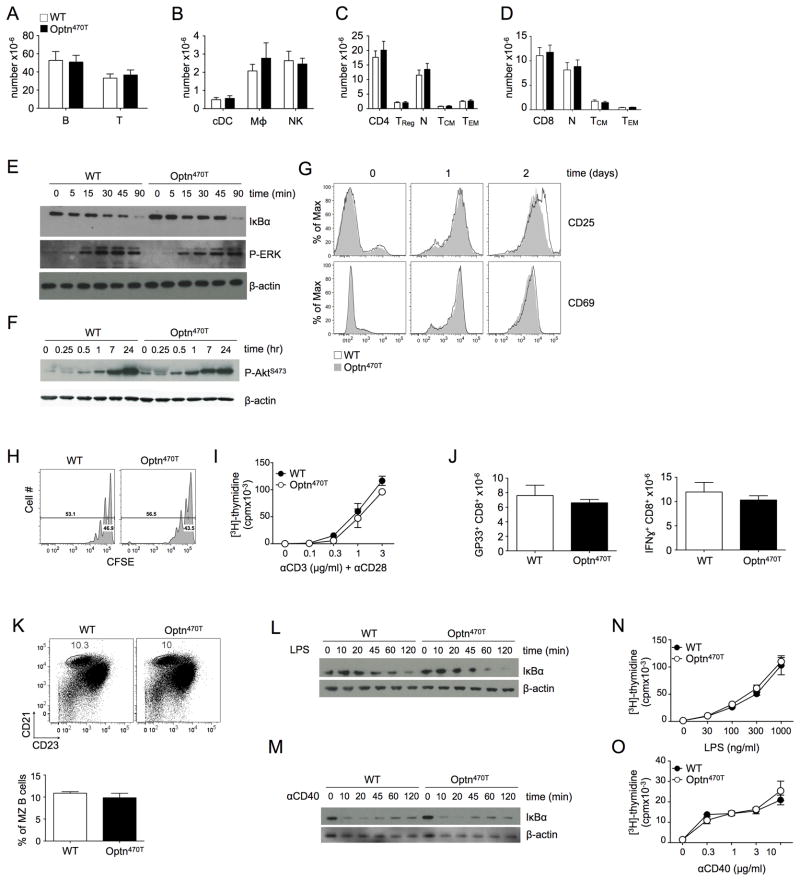
Figure 3. T and B cell development and activation are unimpaired in Optn470T mice.
T and B (A), conventional DC (cDC), macrophage, and NK cell numbers (B) in spleens of the indicated mice are shown. CD4 (C) and CD8 T cell (D) numbers and their respective compartments are shown. Naïve cells were gated as CD44loCD62Lhi, TCM as CD44hiCD62Lhi, and TEM as CD44hiCD62Llo. The data from 8 mice is shown with mean ± SEM. T cells freshly purified or stimulated with anti-CD3 (3 μg/ml) and anti-CD28 (2 μg/ml) were lysed at the indicated times, and IκBα degradation and ERK1/2 phosphorylation (E), and Akt phosphorylation (F) were detected by immunoblotting. Expression of the indicated activation markers was monitored on WT and Optn470T purified T cells at the indicated times after stimulation with plate-bound anti-CD3 (3 μg/ml) and anti-CD28 (2 μg/ml) (G). CFSE-labeled T cells were stimulated as in C, and CFSE dilution was monitored after 60 hr (H). Purified T cells were cultured with 2 μg/ml of anti-CD28 and the indicated concentrations of anti-CD3 for 48 hr, pulsed with [3H]-thymidine, and harvested 18 hr later (I). WT or Optn470T mice were infected with LCMV Armstrong and the absolute numbers of GP33-tetramer+ CD8 T cells analyzed on the peak of the response (day 8; J, left panel). Splenocytes were restimulated in vitro with GP33 peptide and evaluated for cytokine production by intracellular staining. Absolute numbers of IFN-γ producing CD8 T cells are shown (J, right panel). The data represent mean ± SEM of 6 individual mice per strain from two independent experiments. Distribution of CD21hiCD23int MZ B cells (gated in B220+TCRβ- population) in splenocytes of WT and Optn470T mice was determined by flow cytometry. Numbers represent the percentage of cells in the gated region and the bar graph below represents the average of 3 mice per group ± SEM (K). B cells freshly purified or stimulated with LPS (100 ng/ml) (L) or anti-CD40 (1 μg/ml) (M) were lysed at the indicated times and IκBα was detected by immunoblotting. Purified B cells were cultured with the indicated concentration of LPS (N) or anti-CD40 (O) for 48 hr, pulsed with [3H]-thymidine, and harvested 18 hr later. Each panel is representative of two or three independent experiments.

