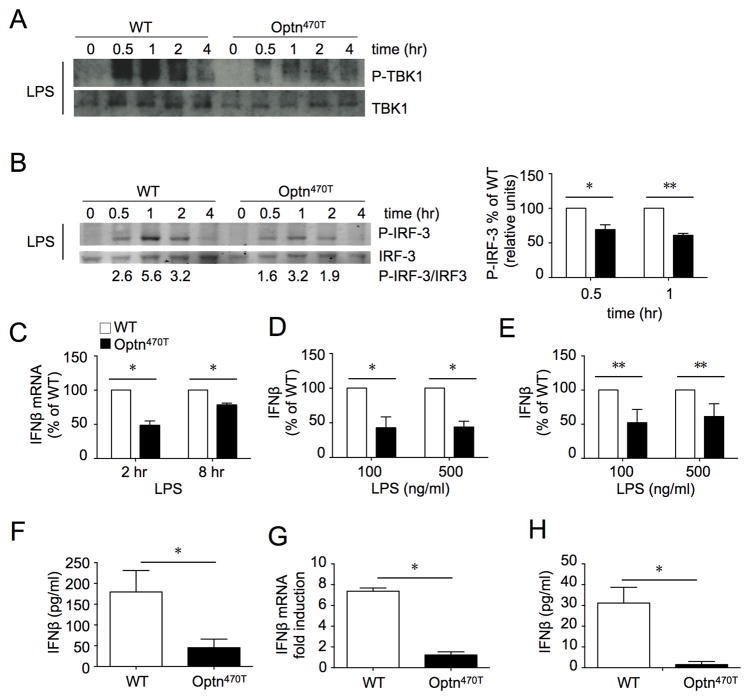
Figure 5. BMDM and BMDC from Optn470T mice have diminished IRF3 responses.
Phospho-TBK1, total TBK1 (A), and phospho-IRF3 and total IRF3 (B) were detected by blotting lysates of BMDM from WT and Optn470T mice at the indicated times after LPS treatment. The lanes were rearranged for clarity. A representative blot of 5 experiments is shown. The densitometry was done on two phospho-IRF3 and total IRF3 blots that were developed with fluorescently-labeled secondary antibodies; numbers below the blot represent the quantitation, and an average of two independent experiments ± SD is displayed (right panel). mRNA for IFN-β was amplified from BMDM at 2 and 8 hr (C), and IFN-β was measured in supernatants at 24 hr (D) after LPS treatment. The mean ± SEM of Optn470T is depicted as percent of WT. IFN-β in supernatants of WT and Optn470T BMDC treated with LPS (E). The data are representative of 2–5 experiments each. IFN-β was measured in the sera of WT and Optn470T mice 6 hr after LPS injection (F). An average of seven mice ± SEM is shown per each genotype. BMDM from WT and Optn470T mice were stimulated with CpGA (2 μM). mRNA for IFN-β was amplified after 8 hr (G), and IFN-β was measured in supernatants at 24 hr (H). The data represent mean ± SD measured from two independent experiments. * p < 0.05; ** p <0.001.

