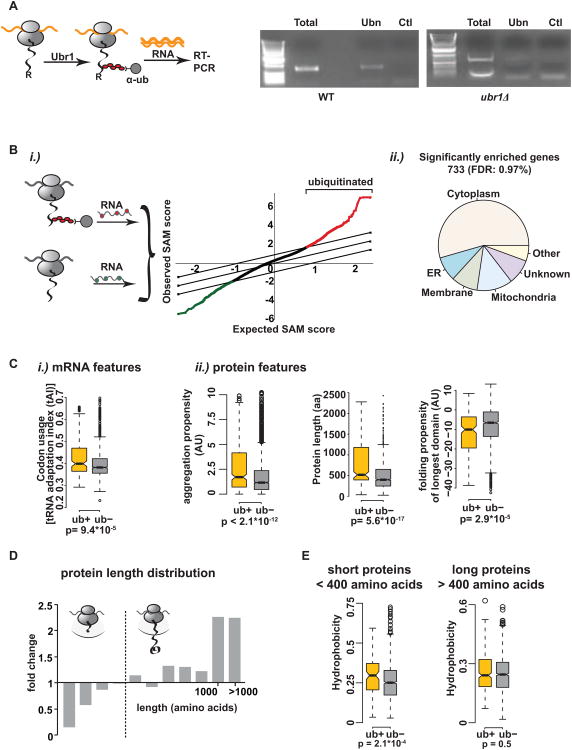
Figure 4. Identification and characterization of ubiquitinated nascent chains.
(A) (Left) Experimental setup: R-β-galactosidase is ubiquitinated cotranslationally by Ubr1. After RNC isolation with polyUb-affinity resin, RNA is extracted and reverse transcribed. (Right) RT-PCR detects cotranslational ubiquitination of R-β-galactosidase in WT but not in ubr1Δ cells. T = total, Ubn = polyUb-affinity isolation, Ctl = GST-pulldown. (B)i.) Globally identification of ubiquitinated nascent chains in vivo. After RNC isolation and ubiquitin-pulldown, RNA was extracted. An aliquot of mRNAs from the initial RNCs serves as total translation reference. Both RNA samples are reverse transcribed, labeled with Cy3 and Cy5, respectively and labeled cDNAs hybridized to DNA microarrays. The graph shows a representative SAM plot for 10 WT replicates with a false discovery rate (FDR) of 1%. Red = significantly positively enriched genes; green = significantly negatively enriched genes in the data set. A set of 733 proteins is consistently ubiquitinated cotranslationally (ub+ set). ii.) Subcellular distribution of cotranslationally ubiquitinated proteins in WT yeast. (C) Features in the mRNA and polypeptide distinguishing the ub+ set from cytosolic proteins not in the dataset (ub-): i.) mRNA: tRNA adaptation index. ii.) protein features: aggregation propensity, protein length and folding propensity of the longest domain. (D) Cotranslational ubiquitination is disfavored in shorter proteins. Size analysis of the identified genes from WT experiments. Fold change of amino acid length compared to the genome. (E) Shorter ubiquitinated nascent chains (encoding proteins <400 amino acids) tend to be more hydrophobic. The cytosolic ub+ dataset was split into proteins shorter and longer than 400 amino acids and the overall hydrophobicity was compared separately to proteins of similar size distribution in the ub-data set. See also Figure S4 and Table S1.

