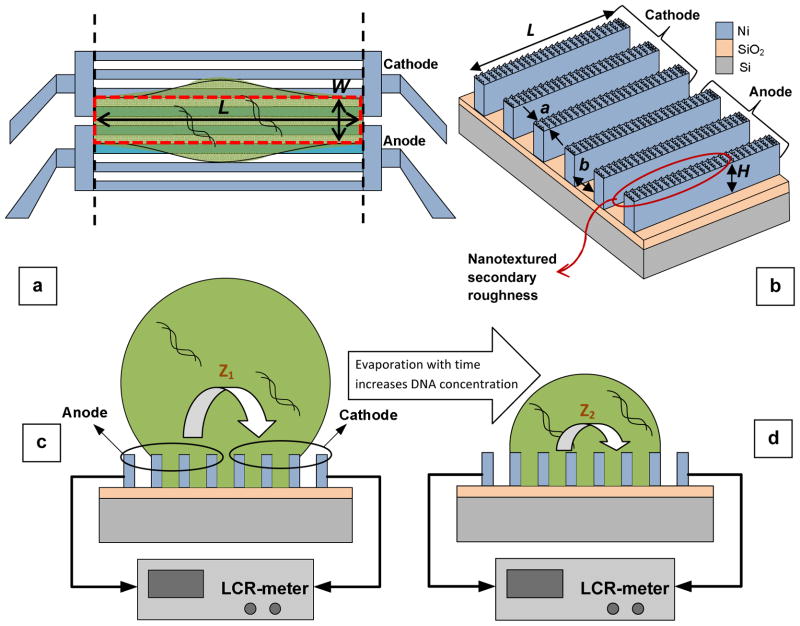
Fig. 1.
Schematic diagram of: (a) top view of a pinned elongated droplet containing DNA molecules on the asymmetric hydrophobic fin array that forms the anode and cathode electrodes. The black dashed lines indicate the sensor edges to which the droplet parallel spread is limited, and the red dotted rectangle shows the droplet contact line which does not change with time. (b) Multifunctional electrode array with the design parameters denoted. Also, the nanotextured surface of the Ni-electrodes is pointed out by the red oval. (c) Impedance measurement system for the droplet at time t1, and (d) impedance measurement of the same droplet at a later time t2 (t2 > t1). Over time, droplet evaporation results in an increase in concentration of the DNA molecules in solution, which consequently leads to an increase in the solution conductance (equivalently, a decrease in the impedance magnitude).

