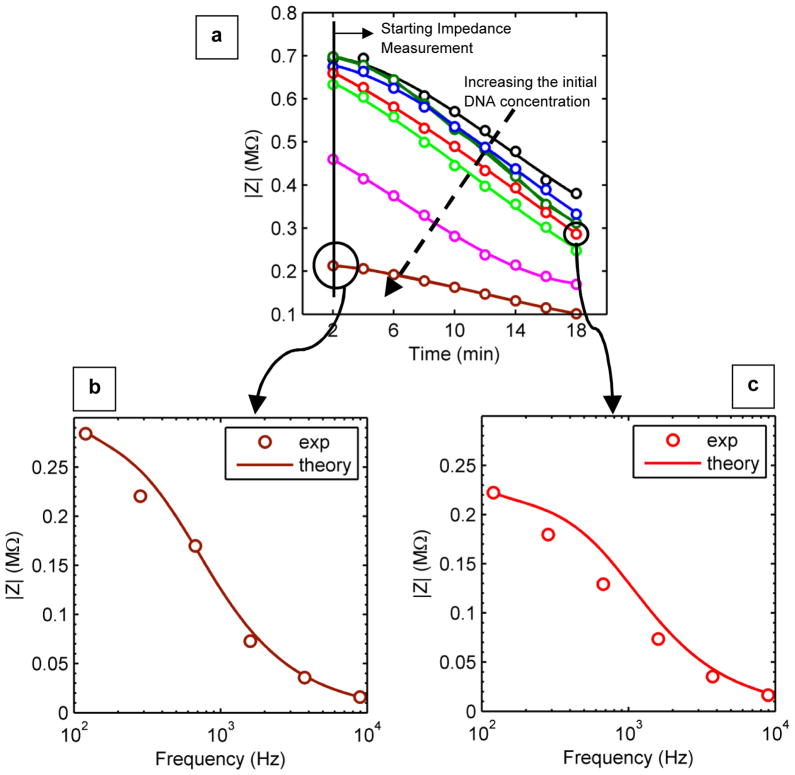
Fig. 3.
(a) Average impedance magnitude (|Z|) as a function of time for different initial DNA concentrations. At each time, the higher the solution concentration, the lower its impedance magnitude. In addition, over time, the impedance magnitude decreases as the droplet evaporates. The applied frequency is 120 Hz. The dashed arrow indicates the increase of the initial concentration: DI water (black), 6 aM (dark green), 60 aM (blue), 1 fM (red), 50 fM (light green), 33 pM (magenta), and 160 pM (brown). From this figure it is clear that the sensor does not distinguish the 6 aM DNA concentration from the 60 aM concentration, and therefore the detection limit is ~60 aM. (b) Experimental data for impedance magnitude versus frequency at 2 min after deposition of a 160 pM droplet on to the electrode surface. (c) Measured data for impedance magnitude versus frequency 18 min after deposition of a 1 fM droplet. In part (b) and (c), the solid lines indicate the simulation results which are in reasonable agreement with the experimental results.

