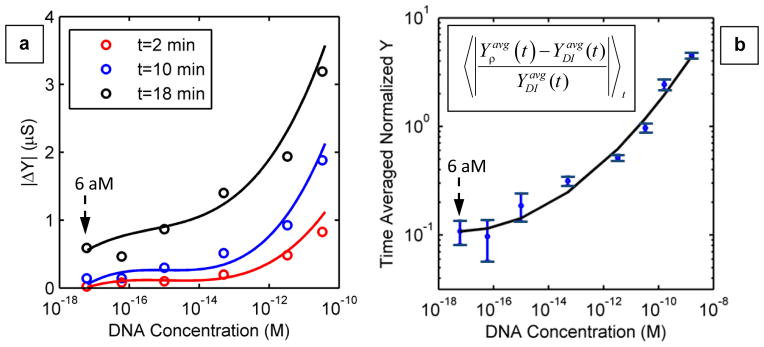
Fig. 4.

(a) The relative change in admittance (Y) magnitude with respect to DI water ( , where Y = 1/Z) as a function of the initial DNA concentration (ρ), after 2 min (open red circles), 10 min (open blue circles), and 18 min (open black circles) of droplet deposition on device surface. The average from three different impedance measurements is plotted in each case. (b) Time-averaged magnitude of the normalized relative admittance with respect to DI water (defined by the given relationship in the plot) as a function of DNA concentration. From this plot, it is concluded that the detection limit would be ~60 aM. The solid lines in both figures are merely trendlines. This plot is derived from three independent measurements. The error bars correspond to the standard deviation of the experimental values.
