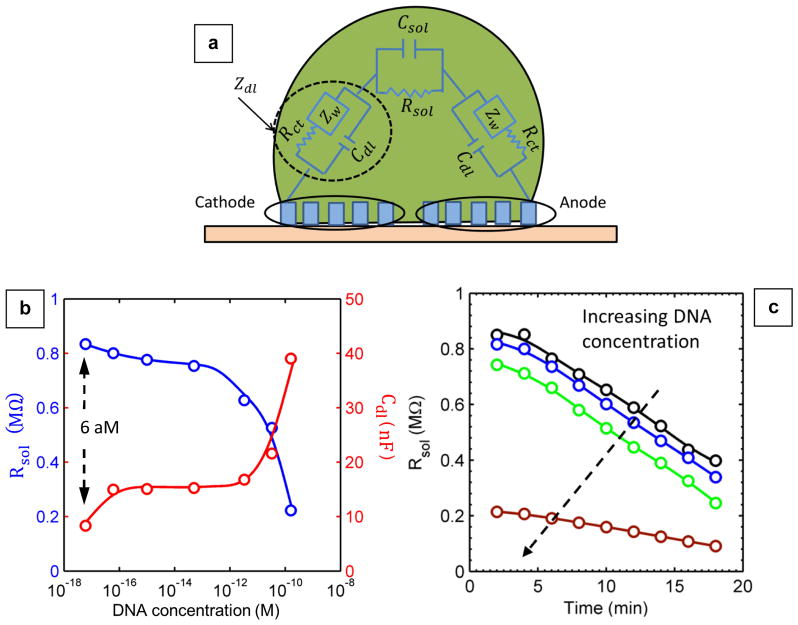
Fig. 5.
(a) Equivalent circuit diagram for droplet impedance. (b) Extracted Rsol (blue circles) and Cdl (red circles) as a function of DNA concentration for t = 2 min. With the increase in DNA concentration, Rsol and Cdl show a steep decrease and increase, respectively. (c) Plot of Rsol with time at different DNA concentrations for DI water (black), 60 aM (blue), 50 fM (light green), and 160 pM (brown). Solid lines in the figures are merely trendlines.

