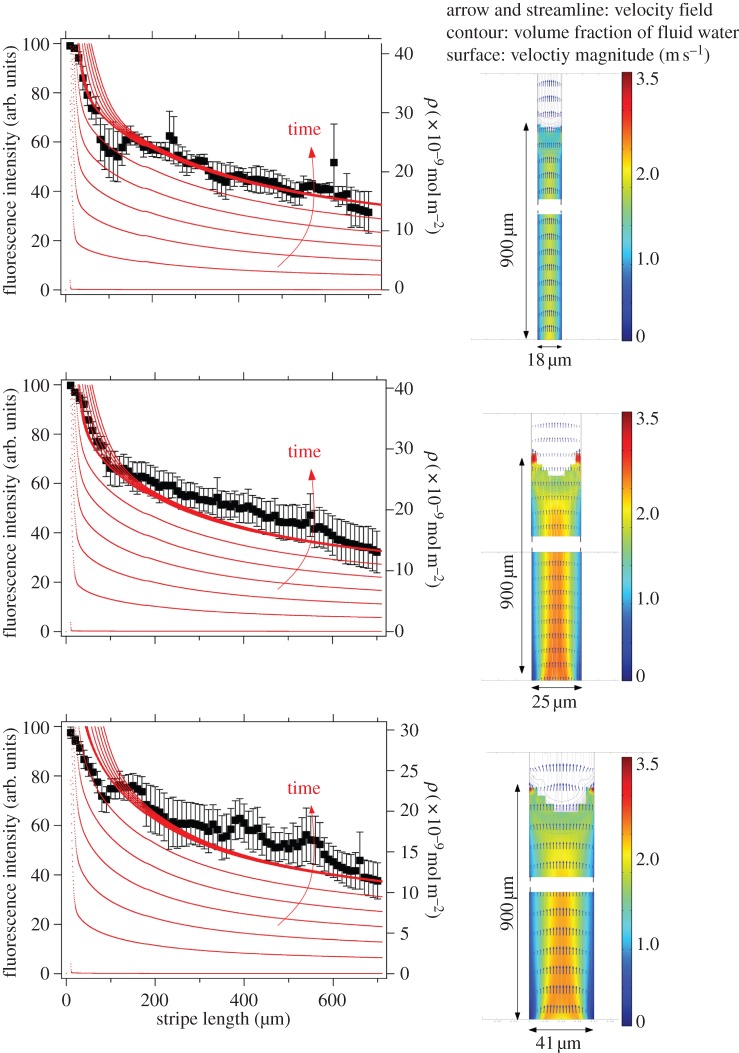
Figure 2.
Laminin gradient analysis. (right panel) Velocity fields calculated on the horizontal plane of microchannels with width equal to 18, 25 and 41 μm; (left panel) representative data of laminin fluorescence intensities (y-axis, left) versus stripe length are shown for the same stripes. The black dots outline the decrease in fluorescence intensity. Concentration of adsorbed laminin (y-axis, right), obtained from finite-element calculation (see the electronic supplementary material), is plotted versus stripe length (continuous lines). The concentration gradient is increasing with time during MIMICs deposition.

