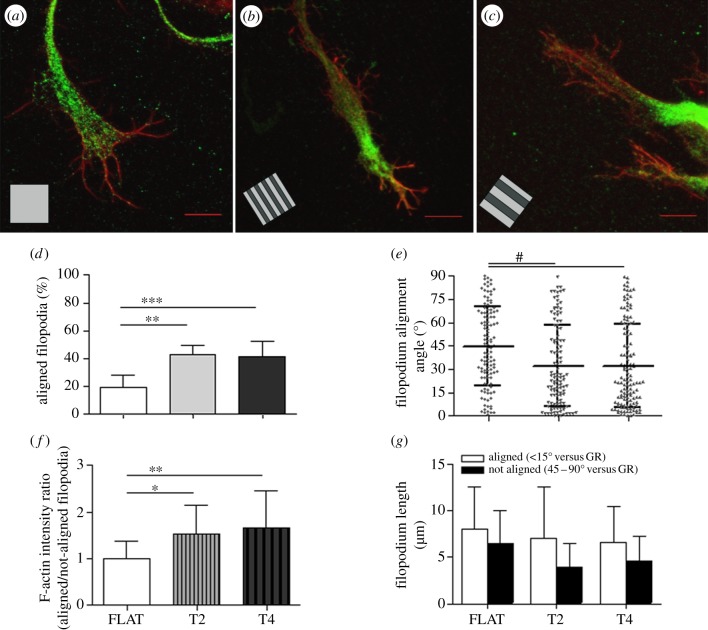
Figure 4.
(a–c) High-resolution confocal images of filopodia, immunostained for actin (red), at the GCs of neurites on FLAT (a), T2 (b) and T4 (c); scale bars, 10 μm. (d–g) Filopodia at the GCs were traced and analysed: (d) percentage of aligned filopodia to the GR (alignment angle less than or equal to 15°); (e) mean filopodium alignment angle for the different substrates; (f) F-actin intensity in filopodia is reported as the ratio of the actin signal in aligned/not-aligned filopodia; (g) mean length of filopodia at GCs, divided into alignment categories. (d–f) *p < 0.05, **p < 0.01, ***p < 0.001, one-way ANOVA, Tukey's test; (e) #p < 0.001, one-way ANOVA, Kruskal–Wallis test. Data are reported as mean ± s.d.

