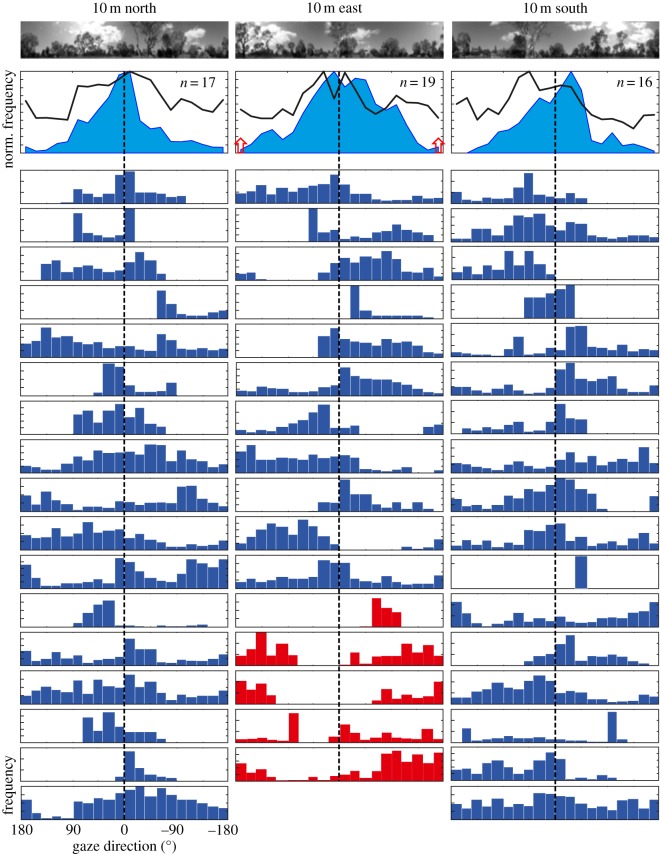
Figure 5.
Scanning gaze direction and the local panorama at 10 m release stations. Top row shows the nest-oriented panoramic scenes at the north (left), east (centre) and south (right) release stations oriented south, west and north, respectively. Second row shows compound gaze histograms of all zero-vector ants released at the three sites, sorted depending on whether the ants walked slower than 5 cm s−1 (black lines) or faster than 5 cm s−1 (blue filled areas). Histograms show means of individual ant histograms that were normalized to one. Path integration directions are indicated by red arrows. Blue-barred histograms are gaze directions for the whole time each of 17 individual ants spent on the platform, each released at three stations (rows 1–11) or at two stations (rows 12–17). Dashed lines at 0° indicate true nest direction. Red-barred histograms for the 10 m east release station are the gaze directions of five full-vector ants.

