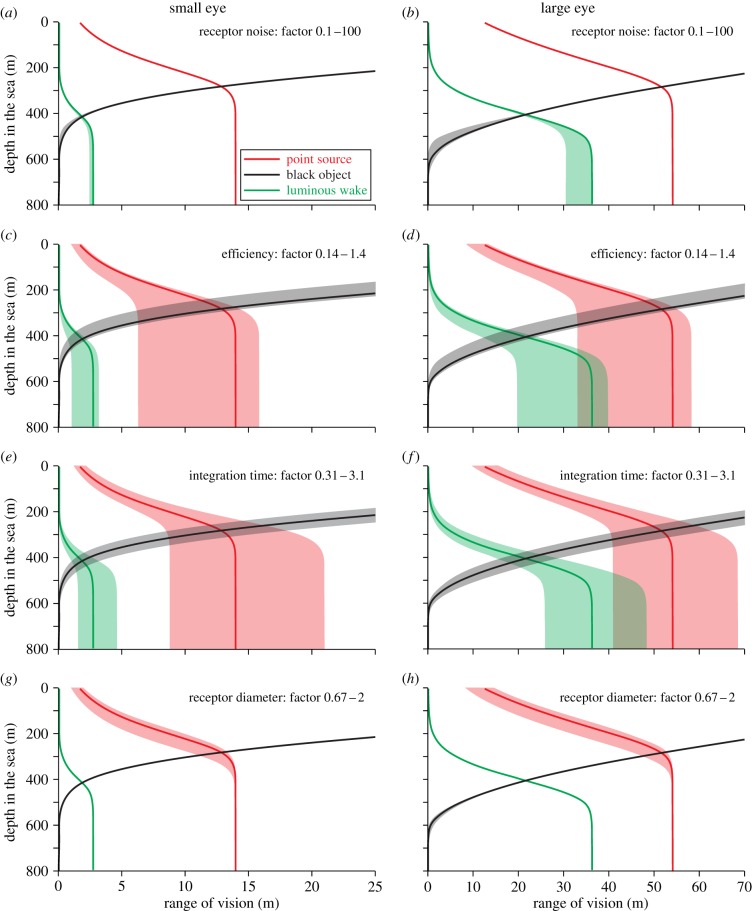
Figure 10.
The effect of variations in (a,b) receptor noise, (c,d) quantum efficiency, (e,f) integration time and (g,h) receptor diameter. The solid lines are calculated for the typical values indicated in table 1, and the shaded areas indicate the consequence of decreasing and increasing the values by the factors indicated in each panel. The left column of panels is calculated for a small eye (pupil diameter 2 mm) and the right column for a large eye (pupil diameter 20 mm). Calculations are for daytime horizontal viewing in oceanic water, the point source intensity is 1011 quanta s−1 and 0.3 m NND (SB side view, see table 2), and the extended target width is 0.3 m wide.

