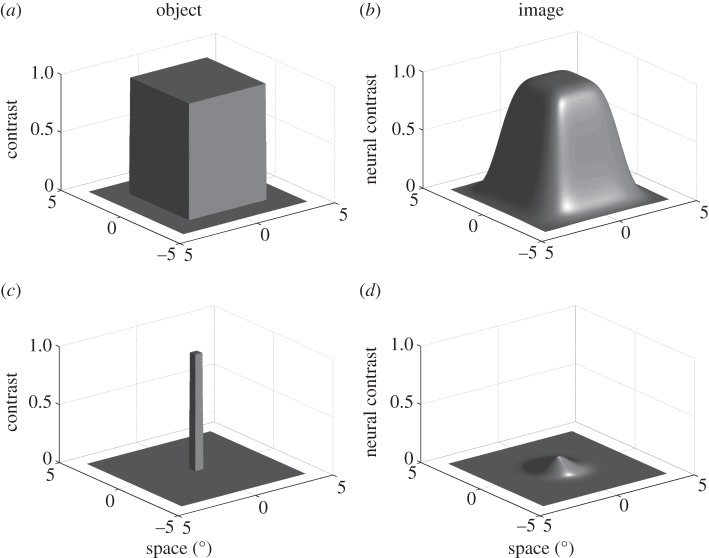
Figure 2.
Optical modelling of large and small features in the retinal image. (a) Luminance distribution of a 5 × 5° object. The z-axis shows relative luminance (contrast). (b) Luminance distribution in the retinal image of the same feature for an eye with an acceptance angle (Δρ) of 1.4°. The peak contrast for the image is similar to that of the object. (c,d) Similar analysis for a 0.5 × 0.5° feature shows reduced contrast in the retinal image (peak = contrast 0.106). Note the resemblance of the retinal image to the 1.4° Gaussian function used to blur the object.

