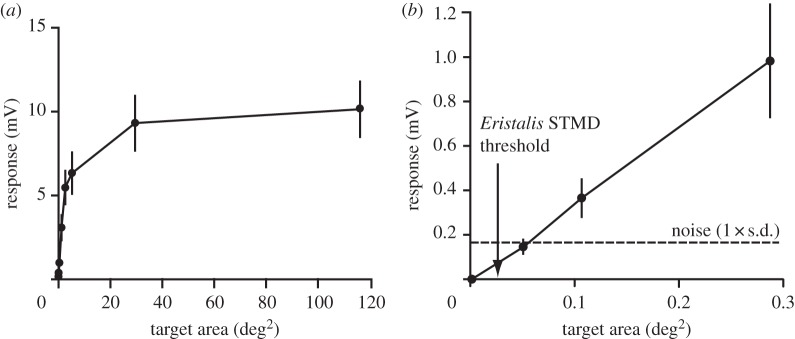
Figure 5.

Sensitivity functions averaged from nine photoreceptors in response to different-sized black targets, as in figure 4, in this case plotted against the area of the target (which should be approximately proportional to neural contrast for targets below the resolution limit of the eye). All targets had the same Weber contrast (1.0). (a) As predicted by the optical model, response peaks saturate at target sizes above 3° (i.e. 9 deg2); (b) detail for small targets shows the linear relationship. The noise level shown (1 s.d.) was determined by recording the membrane potential to the background stimulus, i.e. a bright stimulus screen (see appendix). The arrow indicates the smallest target size for which responses were previously observed in higher-order STMD neurons of the hoverfly, Eristalis tenax [26].
