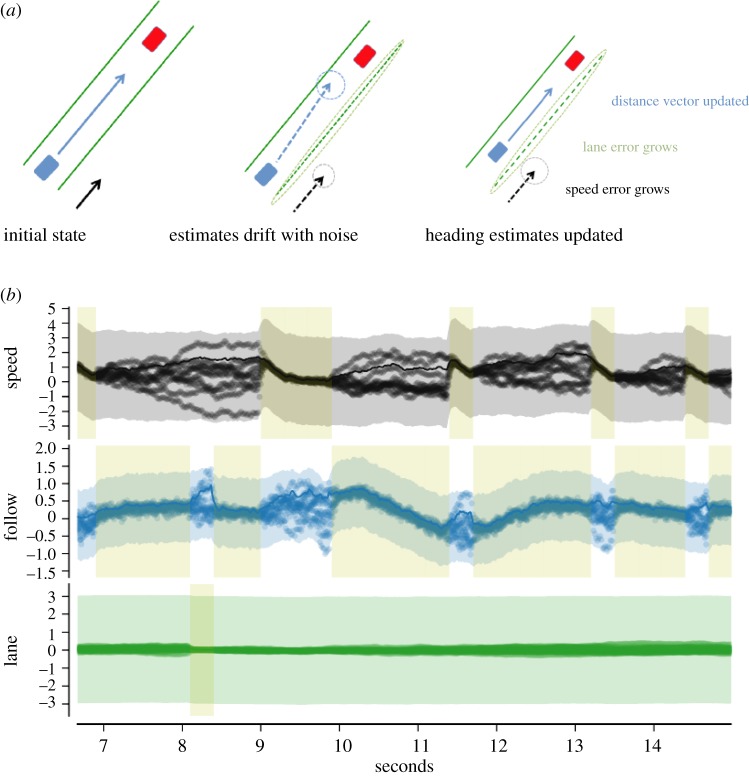
Figure 2.
Evolution of state variable and uncertainty information for three single-variable modules. (a) Depiction of an update of the Follow module. Starting in the initial state, the necessary variables are known, but noise causes them to drift. According to the model probabilities, the Follow module is selected for a gaze induced update. This improves its state estimate while the other modules' state estimates drift further. (b) Depiction of the state estimates for the three modules: constant speed maintenance, leader following and lane following. In each, the line indicates a state estimate versus time for that module's relevant variable, in arbitrary units. Thus, for the speed module, the y-axis depicts the car's velocity, for the follow module it depicts the distance to a set point behind the lead car, and for the lane module it shows the angle to the closest lane centre. If estimates overlap into a single line, the module has low uncertainty in its estimate. If estimates diverge, making a ‘cloud’, the module has high uncertainty. An actual update from the simulation for the Follow module can be seen at 10 s. The fixation, indicated by pale shaded rectangle, lasts for 1.5 s. The figure shows how the individual state estimates drift between looks and how the state variables are updated during a look. The coloured transparent region shows σ(t) ± ρ(t) for each module. (Online version in colour.)

