
Figure 1.
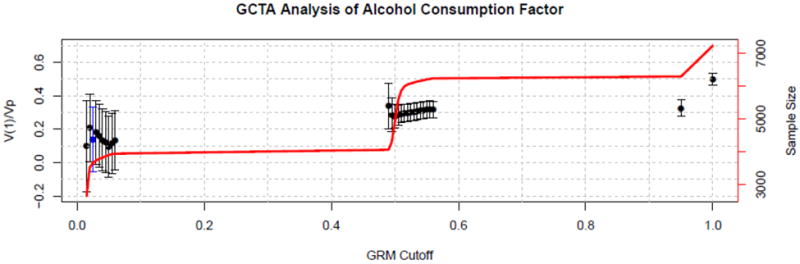
GCTA estimate of the proportion of variance in the Alcohol Consumption factor accounted for by additive genetic effects as a function of the coefficient of genetic relatedness (GRM) threshold. Error bars demarcate plus/minus two standard errors from the estimates. The solid line gives the sample size upon which the corresponding GCTA estimate is based. When the GRM threshold hits .50, first-degree relative pairs are included in the analysis, and when it hits 1.0, monozygotic twin pairs are also included. The standard GCTA estimate is based on a GRM threshold of .025, which is highlighted in blue in the plot.