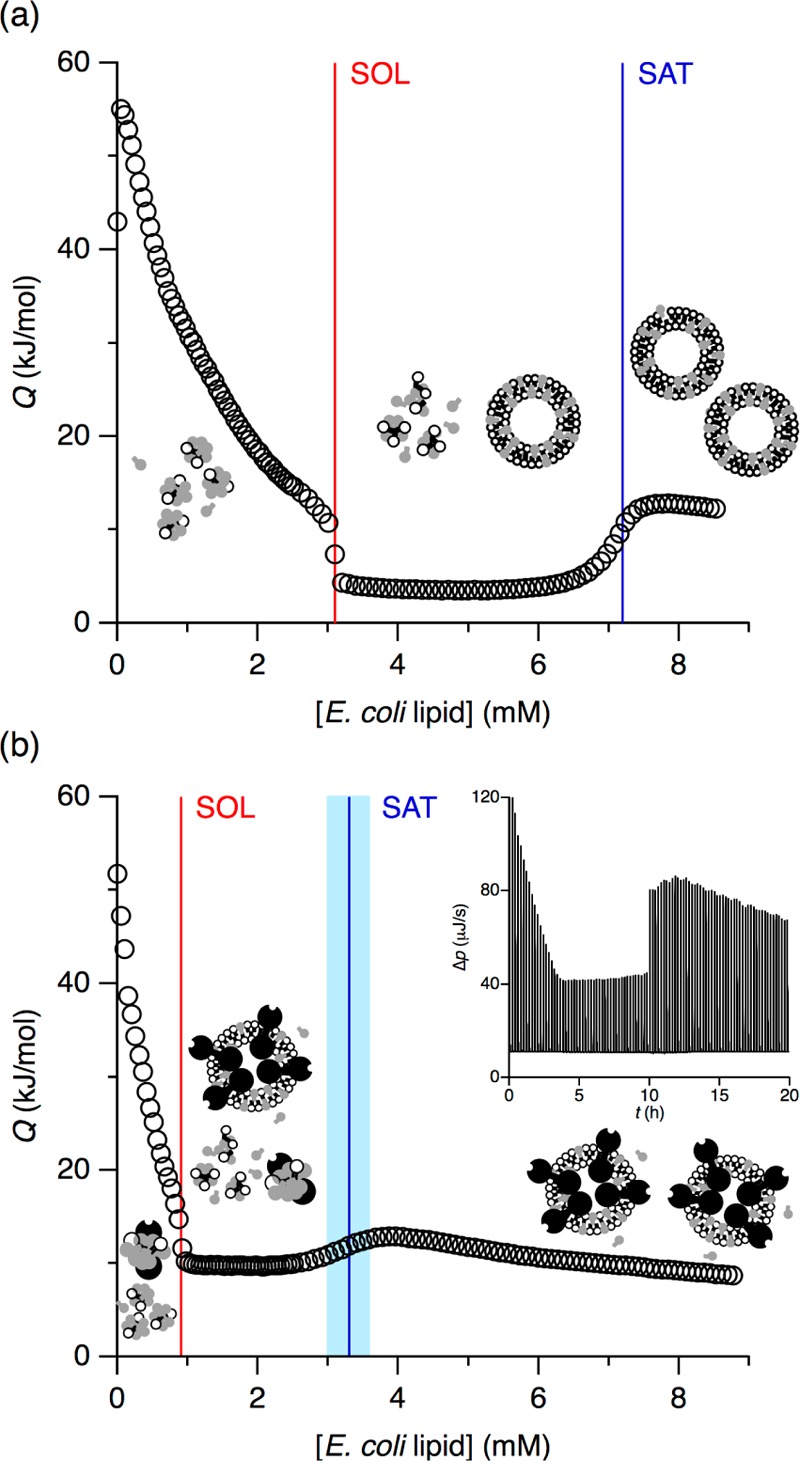
Figure 1.

ITC reconstitution isotherms in (a) the absence or (b) the presence of 1.5 μM KcsA tetramer at 8 °C. Both isotherms depict the heats of reaction, Q (circles), obtained upon titration of 35 mM OG with 50 mM E. coli polar lipid extract. Also shown are the SOL and SAT boundaries (red and blue lines, respectively) and the uncertainty in the SAT boundary in the presence of KcsA (light blue band). Inset: Thermogram displaying differential heating power, Δp, versus time, t. The discontinuity at t ≈ 10 h is due to an increase in injection volume.
