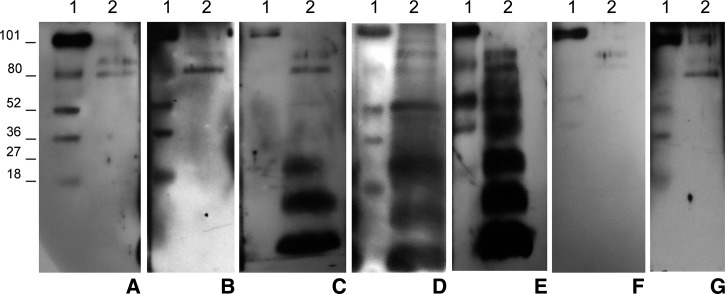
Figure 2.
Representative images of bands pattern recognized by sera from patients with hepatic cystic echinococcosis (CE) in different stages, and control subject using the human hydatid cyst fluid immunoblotting (h-HCF-IB) test based on h-HCF as a source of antigen. Lane 1: molecular weight ladder. Lane 2: h-HCF bands pattern recognized by sera from healthy subjects (A); patients with CE1 (B), CE2 (C), CE3a (D), CE3b (E), and CE4 (F) cysts; other parasitic infections (G); in the case shown Entamoeba histolitica). Note the constant recognition of two unspecific bands of high molecular weight (80–90 kDa) by all samples. The AgB bands of 8, 16, and 24 kDa are recognized by sera from patients with CE2, CE3a, and CE3b cysts, whereas bands belonging to Ag5 (34 and 50 kDa) only by sera of patients with CE3a (weakly or only the band of 50 kDa), and CE3b cysts.

