
FIGURE 3.
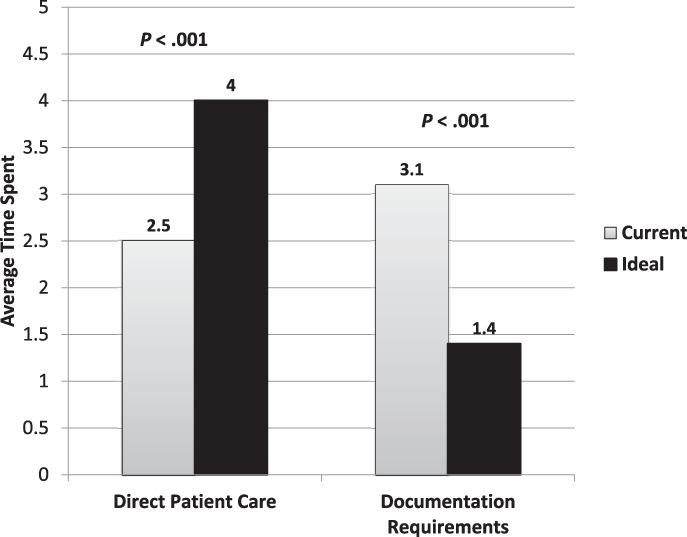
Difference Between Current Time Spent and Ideal Time Allotment for Direct Patient Care and Documentation Requirements. Ordered responses were converted to numeric data as follows: 0%–20% = 1; 21%–40% = 2; 41%–60% = 3; 61%–80% = 4; 81%–100% = 5