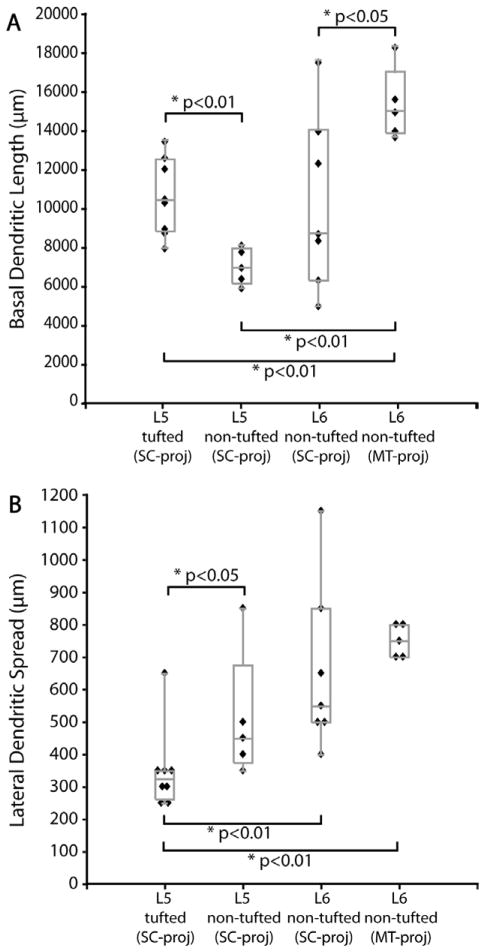
Figure 12.
Comparisons between four types of SC- or MT-projecting V1 neurons for total basal dendritic length (A) and lateral spread of basal dendrites (B). Box-whisker plots (gray) show the median, first, and third quartile, as well as minimum and maximum values. Values are from all the reconstructed neurons, each of which is also plotted separately. Significant differences (Wilcoxon rank sum test) are indicated by brackets and corresponding P values. Tufted refers to the same cell type that is called tall-tufted in the text of the manuscript.

