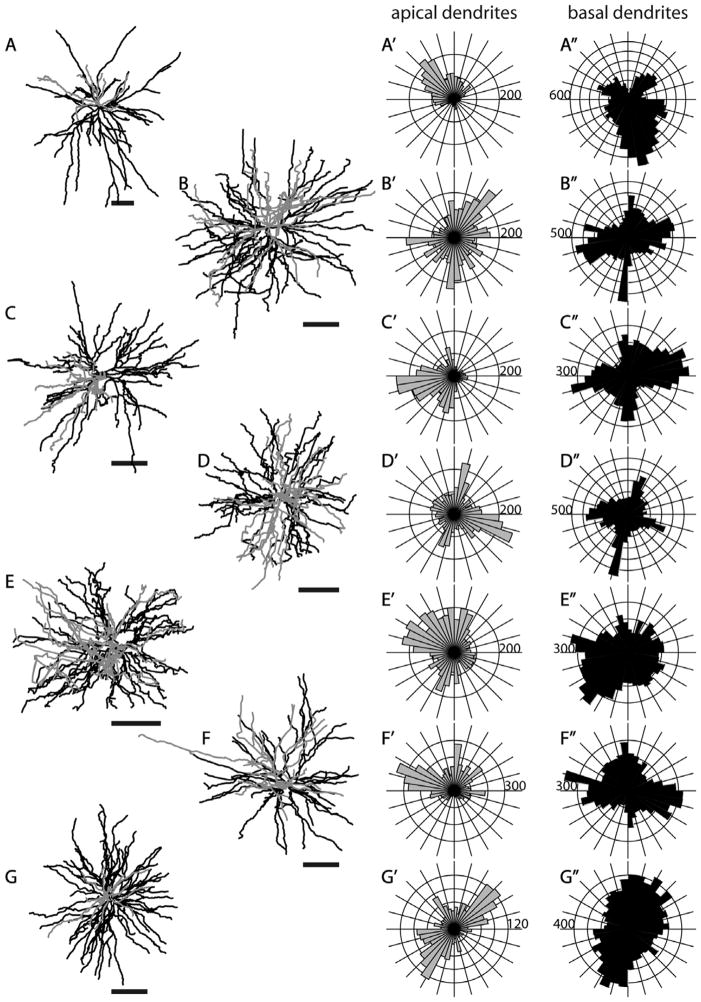
Figure 13.
Morphologies of layer 5 tall-tufted SC-projecting neurons. Top views, as well as circular histograms showing the radial distributions of dendritic length (μm), for all Neurolucida reconstructed neurons with apical and basal dendrites analyzed separately. Same conventions as in Figure 5. The numbers on the polar histograms indicate the dendritic length value at the outermost ring of each histogram. Scale bars for dendritic reconstructions =100 μm.

