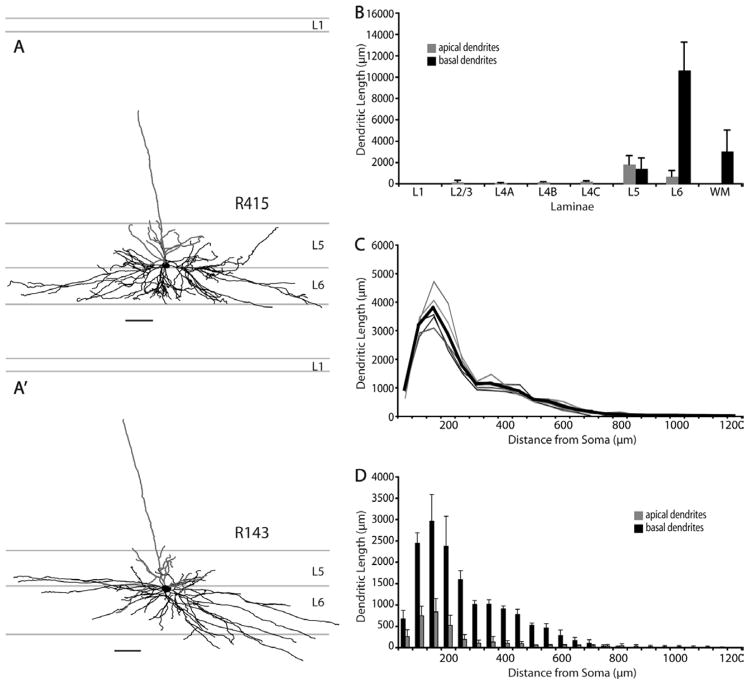
Figure 16.
Morphologies and dendritic distributions of MT-projecting neurons in V1. A,A′: Morphologies of layer 6 nontufted MT-projecting neurons. This cell type has similar morphological appearance to the nontufted SC-projecting neurons. Their apical dendrites restrict the majority of their branches to layer 5 with a single branch extending toward the cortical surface but only reaching as far as layer 2/3, while their basal dendrites are confined to layer 6 and extend long distances laterally. B: Histogram of laminar distribution of apical (gray) and basal (black) dendrites for all reconstructed MT projecting layer 6 nontufted cells (n =5). Values represent mean ± SD. C: Sholl analyses depict individual variability of total dendritic length within the population. Traces in various shades of gray represent individual neurons. Thick black trace represents the average total dendritic length at various distances from soma. Bin size =50 μm. Same conventions as used in Figure 11. D: Sholl analysis of apical (gray) and basal (black) dendritic distribution showing the density of basal dendrites and the extent of spread between apical and basal dendrites. Values represent mean ± SD. Scale bars =100 μm.

