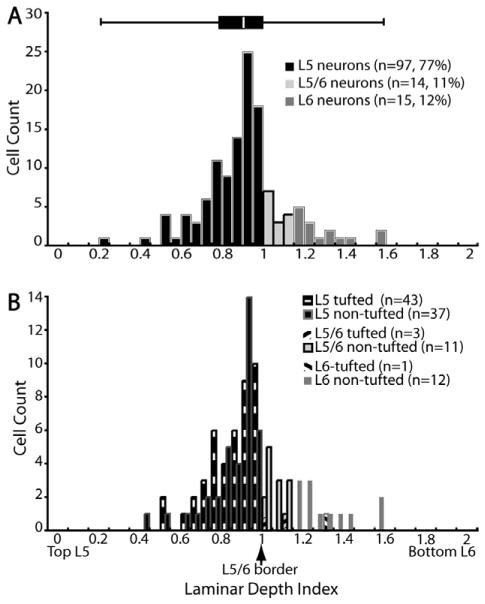
Figure 4.
Laminar distribution of SC-projecting neurons in layers 5 and 6. A: Distribution of neurons in layers 5 and 6 (n =126). Population data is obtained by sampling every cell on every 12th section of the entire striate cortex of monkey HMN2 (see Materials and Methods). Location of soma is expressed as laminar depth index. LDIs of 0, 1, and 2 correspond to somata located at the top of layer 5, at the border between layers 5 and 6, and at the bottom of layer 6, respectively. The overlaying box-whisker plot (top) shows the median, first, and third quartile of the distribution, as well as the maximum and minimum values. Bin size =0.1. B: Laminar distributions of tufted vs. nontufted SC-projecting cells (n =107). Of the 126 cells sampled, 107 cells have identifiable apical dendrites (see Results), and are categorized as tufted vs. nontufted. Tufted refers to the same cell type that is called tall-tufted in the text of the manuscript.

