
Figure 3.
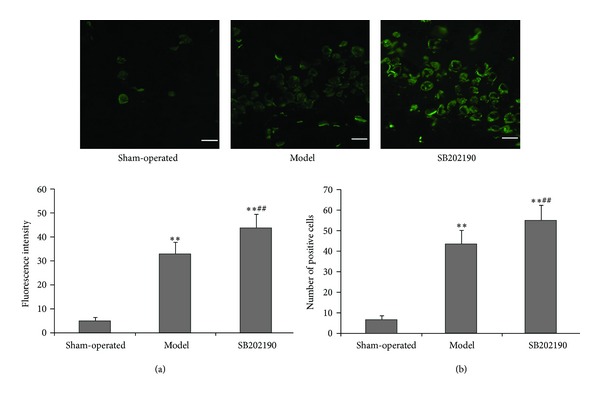
Effect of SB202190 on expression of Bcl-2 in the hippocampus of the VaD rat model. Expression of Bcl-2 was determined by immunofluorescence staining (mMagnification ×40). Green: FITC. (a) Fluorescence intensity; (b) number of positive cells. The data are expressed as means ± SD (n = 6); **P < 0.01 versus sham-operated group, ## P < 0.01 SB202190 group versus model group.