Figure 1.

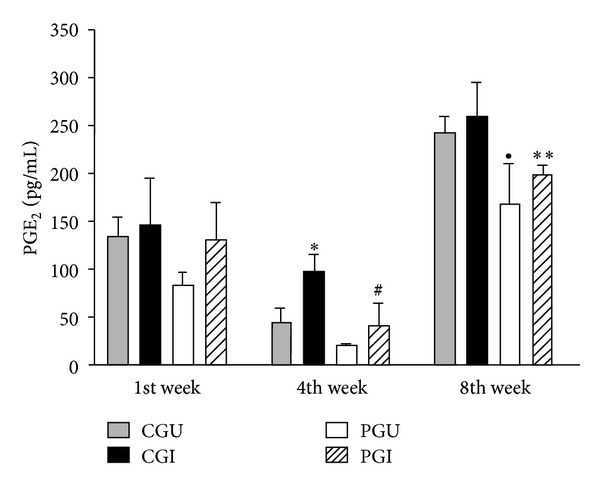
Production of PGE2 in serum of animals of all groups during the experiment. Statistically significant differences P < 0.05: *CGU versus CGI; #PGU versus PGI; ●CGU versus PGU; **CGI versus PGI.

Production of PGE2 in serum of animals of all groups during the experiment. Statistically significant differences P < 0.05: *CGU versus CGI; #PGU versus PGI; ●CGU versus PGU; **CGI versus PGI.