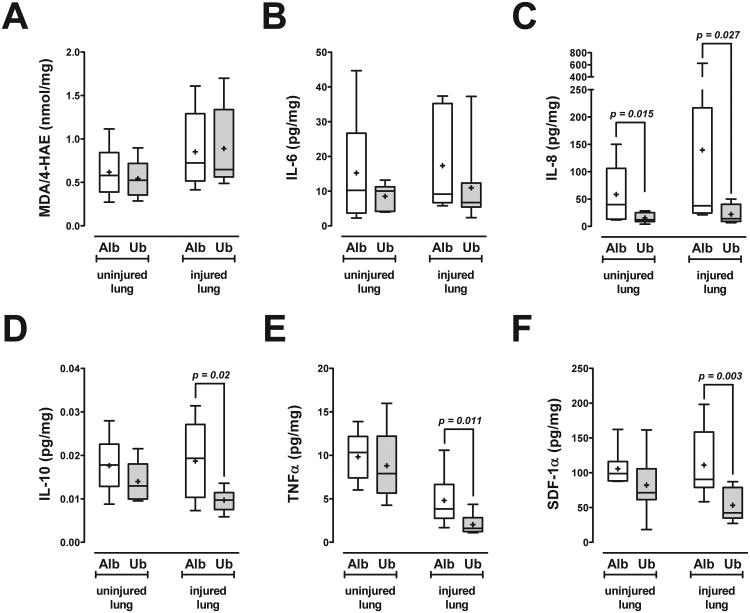
Fig. 6. Surrogate markers of tissue injury and inflammation in lung extracts.
Data are expressed per mg of total protein. Boxes extend from the 25th to 75th percentile; the horizontal line shows the median; the cross indicates the mean. Error bars show the minimum and maximum. Significant differences between the groups are indicated. Alb: Albumin treatment (open boxes; n = 9). Ub: Ubiquitin treatment (grey boxes; n = 8). A. Malondialdehyde (MDA)/4-hydroxyalkenals (4-HAE); nmol/mg). B. IL-6; pg/mg. C. IL-8; pg/mg. D. IL-10; pg/mg. E. TNFα; pg/mg. F. SDF-1α; pg/mg.

