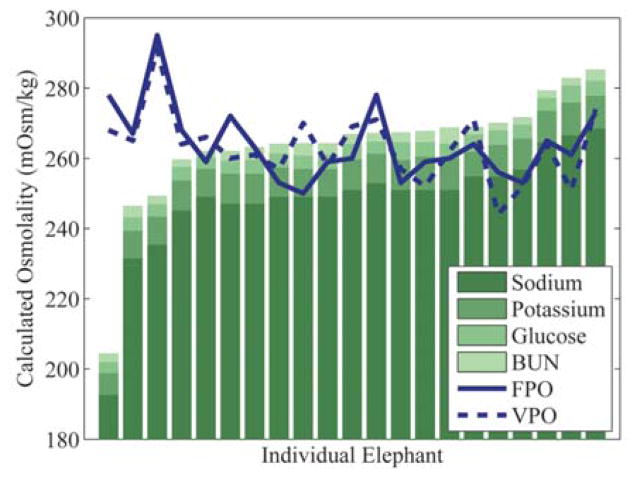
Figure 2.
Asian elephant (Elephas maximus) serum calculated osmolality bar graph with overlaid serum osmometer results. Elephants are sorted on the x-axis in ascending simple formula osmolality (SFO) value. BUN = blood urea nitrogen; FPO = freezing point osmometer values; VPO = vapor pressure osmometer values. Calculated osmolality values shown were generated by SFO. Bars exhibit proportional contribution of solutes used in the SFO formula.

