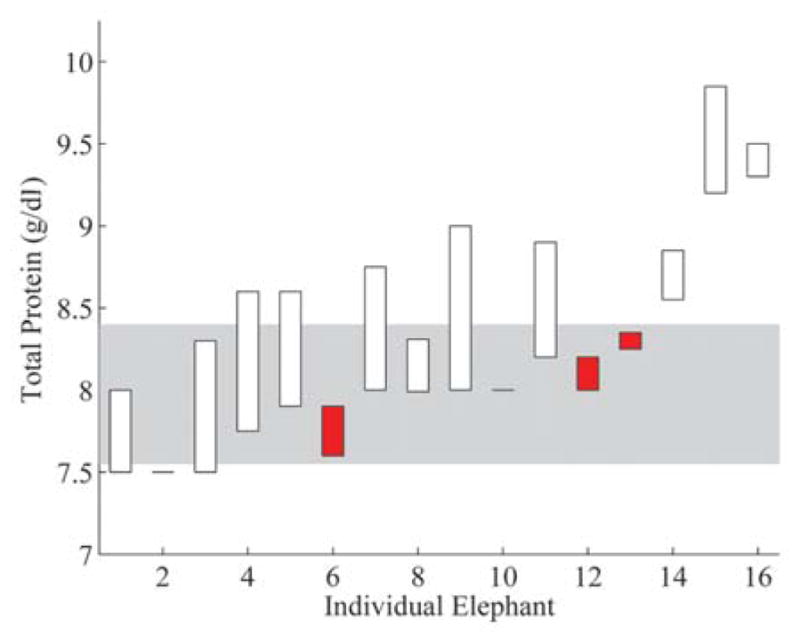
Figure 5.

Total protein by refractometer results from the water deprivation test. Elephants are listed on the x-axis in the same order as Figure 3 and total protein (refractometer) values are on the y-axis. Corresponding results are displayed for each elephant as bars showing the difference between the T0 and T1 total protein values. Unfilled bars indicate elephants with an increase in total protein and filled bars indicate elephants with a decrease in total protein over the water deprivation period. The shaded area represents the interquartile interval obtained from phase 1 results.
