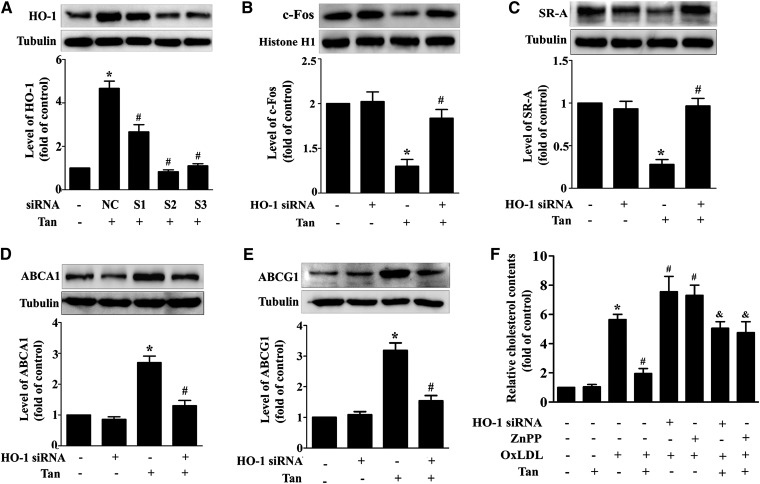
Fig. 6.
Tan regulates cholesterol metabolism through HO-1 activation. A: THP-1 macrophages were transfected with three different siRNAs against HO-1 (marked as S1, S2, and S3), as well as the negative control (NC) for 24 h, followed by Tan (10 μM) treatment for an additional 12 h. Protein expression of HO-1 and α-tubulin was measured by Western blotting. *P < 0.05 versus vehicle-treated group, #P < 0.05 versus NC group. B–E: Macrophages were pretreated with HO-1 siRNA (S2) for 24 h, followed by Tan treatment for an additional 24 h. Protein expression of c-Fos (B), SR-A (C), ABCA1 (D), ABCG1 (E), α-tubulin and histone H1 were determined by Western blotting. *P < 0.05 versus vehicle-treated group; #P < 0.05 versus Tan-treated alone group. F: Macrophages were pretreated with HO-1 siRNA (S2) for 24 h, or preincubated with ZnPP (10 μM) for 6 h, followed by Tan for an additional 24 h in the presence or absence of oxLDL (50 μg/ml); cholesterol content was detected by the Amplex Red cholesterol assay kit. *P < 0.05 versus vehicle-treated group; #P < 0.05 versus oxLDL-treated alone group; and &P < 0.05 versus Tan/oxLDL-treated group.

