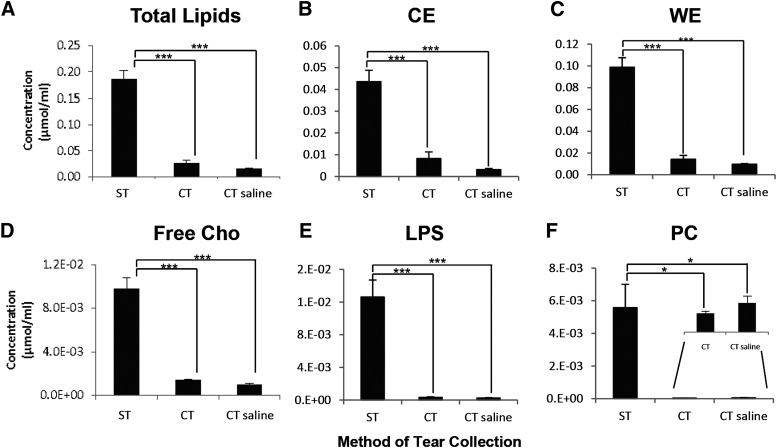
Fig. 2.
Comparison of the absolute amounts of lipids captured using the Schirmer's strips (n = 10) and capillary tubes with (n = 5) or without (n = 5) saline flush. Mean values were plotted. Error bars indicate standard errors of the means. ST, Schirmer's tears; CT, capillary tears; CT saline, capillary tears with saline flush. *** P < 0.001;* P < 0.05.

