
FIGURE 4.
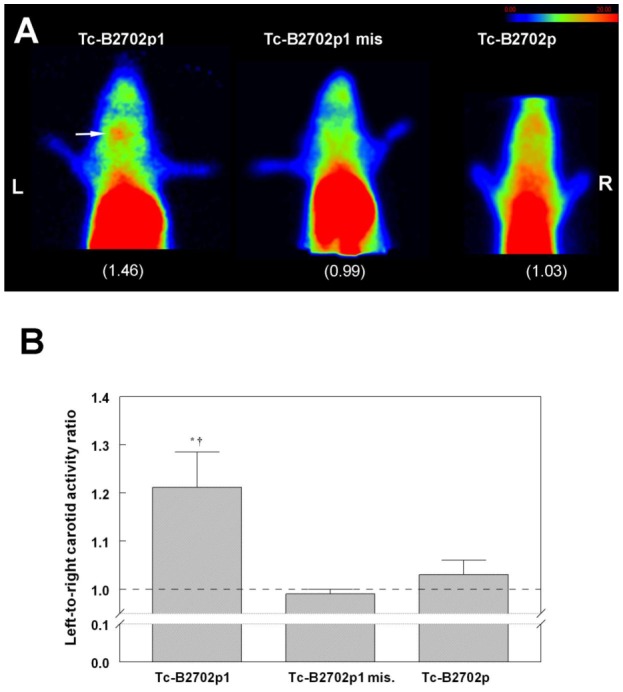
A, Representative planar images of apoE−/− mouse with left carotid artery ligation at 180 min following the injection of Tc-B2702p1 (left), Tc-B2702p1 mismatch (middle), and Tc-B2702p (right). The corresponding left-to-right carotid tracer activity ratios are indicated in parenthesis; B, Tc-B2702p1, Tc-B2702p1 mismatch, and Tc-B2702p left-to-right carotid activity ratios from in vivo planar image quantification. *P<0.05 vs. Tc-B2702p; †P<0.05 vs. Tc-B2702p1 mismatch.